
AG Grid is a mono repo project so there is really only one very important repository ag-grid. So what are all the other repos? Well, we do have examples for AG Grid as React Data Grid Examples, Angular Data Grid Examples, and Vue Data Grid Examples.
This post will provide a quick overview of the React Data Grid example repo with some suggested exercises to act as introductions for developing using AG Grid.
React Data Grid Example Repo
The React Data Grid Example repo has three different project samples.
- A Stock Trading Dashboard simulator.
- An interactive feature example.
- Demonstration of a 'large' grid. (676 columns by 1000 rows)
Contents:
- Getting Started With The Examples
- The Trader Example
- The Large Grid
- The Examples
- Suggested Experiments
- Summary
Getting Started With The Examples
First, we clone, fork, or download the repo from github.com/ag-grid/ag-grid-react-example.
In the root folder, let npm install everything we need:
npm install
Then we can run each of the examples with npm run
npm run tradernpm run examplesnpm run large
The Trader Example
By running npm run trader, the trader app will open in our browser:
npm run trader
The Trader example is a simulated Trader Dashboard.
- Showing 'live' trader prices with three different views.
- Each view is an AG Grid component.
- A Custom Cell Renderer has been created to embed a horizontal bar for some prices in the
FXDataService. - The stock movement pricing rendering showing the change in price against entries entries uses the built-in agAnimateShowChangeCellRenderer.
- One of the data grids is sorted by default, so you can see it updating and resorting as the price values change.
- Different simulated markets can be chosen from a drop-down demonstrating data loading based on user interaction.
- The historical price graph updates when a market row is chosen, demonstrating event handling control available to the programmer.
- Using Data Grids means that the grids can be fixed positions and will automatically size the data in the cells and rows without impacting the view. Unlike an HTML table, the stock price grids will not lengthen or reduce, and no additional coding is required to control the visual layout of the screen.
- Cell class rules have been created to automatically assign different CSS classes based on the value of the data in the
FxDataServicesconfig factory.
By looking through the code, we can see that each of the grids is embedded in a React Component to create: FxQuoteMatrix, PriceChangesGrid and a TopMoversGrid component. Which helps demonstrate reusing AG Grid React component in the context of a domain specific application.
It is a helpful example to dive down into the code and see features in action that you might not have experimented with to provide more options for achieving results like custom cell rendering.
The Large Grid
The Large Grid has a much simpler set of code in the /src-large-data folder.
Run the example with:
npm run large
The example uses programmatically generated data to create a large data set in the browser: 676 columns by 1000 rows.
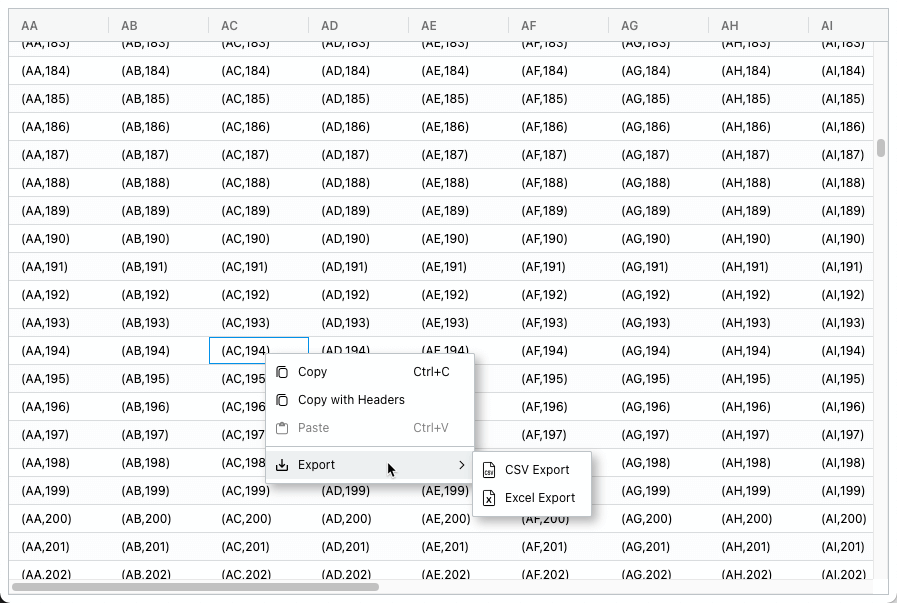
- The grid has column pinning enabled so you can right click on the column header menu to pin the column.
- The grid also has Clipboard, CSV, and Excel export enabled because it uses the Enterprise edition.
We have some suggested experiments below, including; evaluating with different sizes and using pagination.
The Examples
The Examples have a few interactive pages for using declarative markup, Redux, and Hook Components in the /src-examples folder.
Run the example with:
npm run examples
Declarative Markup
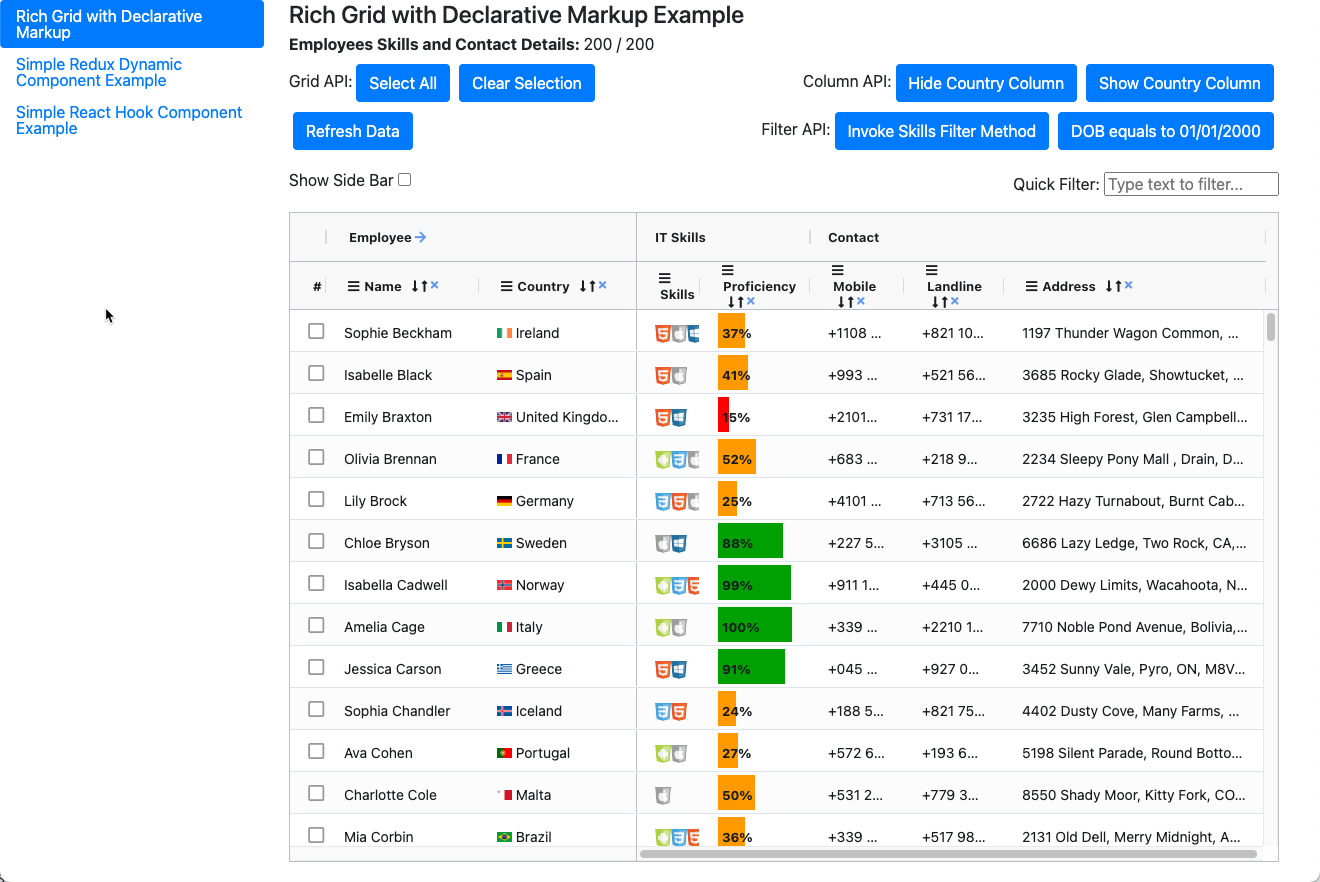
The example demonstrates a surprising amount.
- The Grid API buttons demonstrate calling various parts of the Grid AIP to refresh the data and select or clear selections. These could be using any of the React Data Grid API methods.
- The 'Show Side Bar' reveals the Enterprise edition pivot, column, and filter options so you can
- hide and reveal columns
- pivot data like an Excel spreadsheet
- create complex filters
- The Employee spanned column has the date of birth hidden by default; you can reveal it with the arrow icon next to the 'Employee' header.
- The Column API buttons demonstrate that any of the documented Column API methods are available for use.
- The Quick Filter is a handy way to quickly filter the entire data grid for a partial String match.
- The columns can all be dragged, and you can see the effect on the spanned header column when you do. Also, all columns can be sorted and filtered using the column header menus.
- The Employee name has in-cell editing.
- Custom Cell Renderers for the Date of Birth, Skills, Proficiency.
- And we even through in a Custom Editor for the name, although the built-in editor would work just fine.
Redux Component
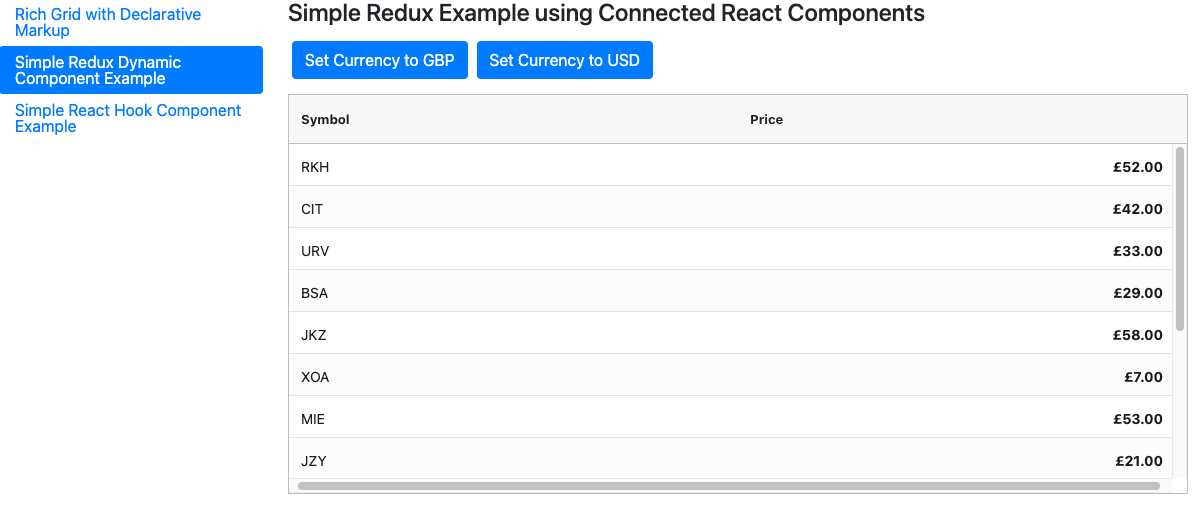
- The Redux component example shows many interacting components e.g. the header with buttons.
- A Redux component provides the row data.
- There is a custom Price Renderer to explore.
React Hook Component
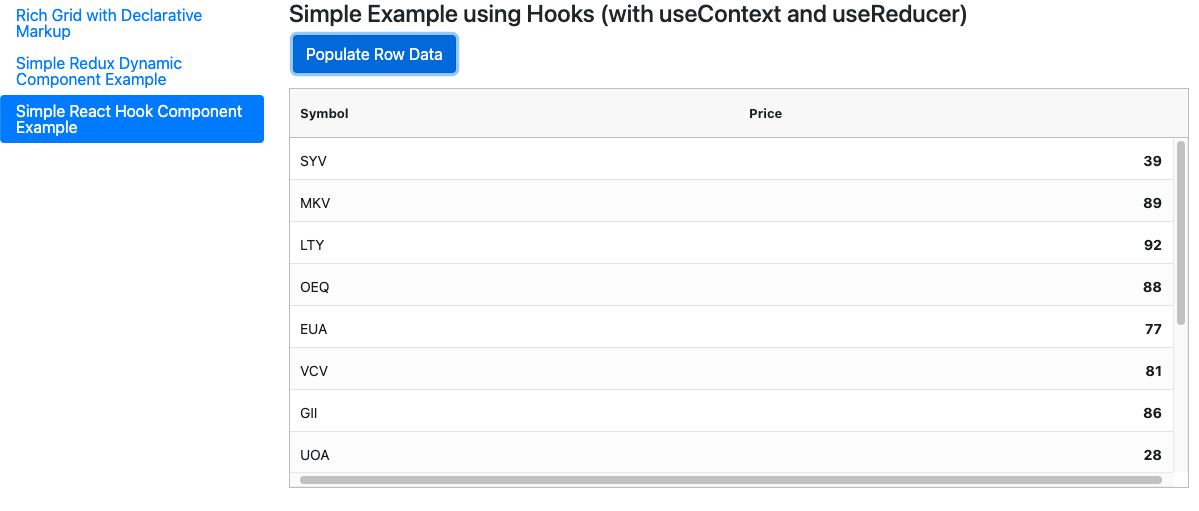
The Redux Hooks Example implements the components as React hooks rather than classes.
- There is a custom editor for the price.
- There is also a custom editor for the price.
Suggested Experiments
We can use the examples as a basis to learn more about AG Grid.
After downloading the project, you might want to try these exercises as a starting point.
Trader Dashboard
Add Your Own Historical Chart
We have a related blog post showing how to create a react data chart for historical data in this example.
Try the Community Edition
We have a tendency internally to default to the Enterprise functionality by default. But one additional feature of this example is that all of the functionality can be achieved using the community edition. As an experiment, you might want to try configuring this project from the enterprise configuration to the community configuration.
The full source is contained in the /src-trader-dashboard folder.
Change all occurrences of ag-grid-enterprise to ag-grid-community in index.js and the three jsx files that use AG Grid: FxQuoteMatrix, PriceChangesGrid and a TopMoversGrid.
The Free React Data Grid Community Edition can power a client-side data financial dashboard with the same high performance as the enterprise edition.
Large Data
Using the large grid code in the /src-large-data folder.
Change the Data Size
The Grid is rather large. But you can use this example to help evaluate AG Grid by changing the row and column sizing to something closer to the type of values used in your applications.
A more realistic set of values might be 20 columns and 5000 rows.
e.g.
this.columnNames = this.columnNames.slice(0,20);
Adding Pagination
Since there are a lot of rows, this data grid might benefit from pagination.
We can enable pagination with the addition of a single property.
Try it out and see if makes the grid more usable:
<AgGridReact
    pagination={true}
    columnDefs={this.state.columnDefs}
    rowData={this.state.rowData}
    modules={AllModules}
/>
Implement Pinning and CSV Export using Community Edition
This example uses the Enterprise edition to enable the right-click menu, Clipboard, and Excel export.
If we dropped down to the Community edition by changing the import in largeGrid.jsx, our easy access to these features disappears.
import {AllCommunityModules as AllModules} from "@ag-grid-community/all-modules";
Column Pinning and CSV Export are part of the community edition, but we would have to amend the application to have buttons that trigger this functionality.
If you want to explore the code in more detail, try amending the example to use community edition and then implement the column pinning and CSV export using a different mechanism e.g. buttons on the page.
This exercise helps demonstrate the extra convenience that the context menu in the Enterprise edition offers.
Declarative Markup Example
Add and Remove Editors and Renderers
In the RichGridDeclarativeExample.jsx try commenting out the custom editors and renderers to see the impact on the grid experience.
Then, for each renderer and editor, read the code for the custom component to see how it works.
e.g.
// cellRenderer={RichGridDeclarativeExample.countryCellRenderer}
Then check the renderer implemented by the countryCellRenderer static method.
And for:
// cellRendererFramework={ProficiencyCellRenderer}
Have a look at the ProficiencyCellRenderer.jsx class.
React Hook Component Example
Change the Price Renderer
The price renderer has not been converted into a functional hook.
- Convert the class to a function hook.
- Render the price in bold.
Summary
We have examples for AG Grid in react, angular, and vue.
Complete documentation for the React Data Grid can be found here
We also have additional material in the react data grid blog examples repo and the react data grid examples overview page.