
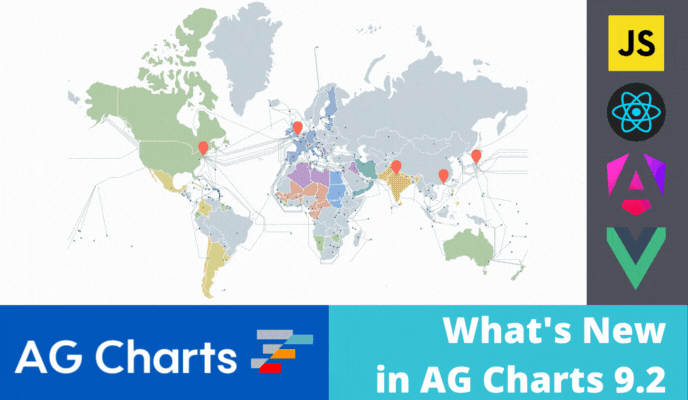
AG Charts 9.2 is an important minor release which adds Map Series types for visualising geographic data. It also includes further enhancements to existing features.
- New Map Series Types
- Map Series for Geographic Areas
- Map Series for Routes and Connections
- Map Series for Markers and Points of Interest
- Rounded Corners for All Bar Series
As this is a minor version there are no breaking changes for anyone upgrading from AG Charts 9. However, we recommend reading the migration guide and reviewing the list of changes in the release notes when planning to update to this version.
New Map Series Types
AG Charts now includes new Map Series Types for visualising geographical data. These divide into three types which can be used independently or combined to provide contextual or additional data.
See this documented here and illustrated below.
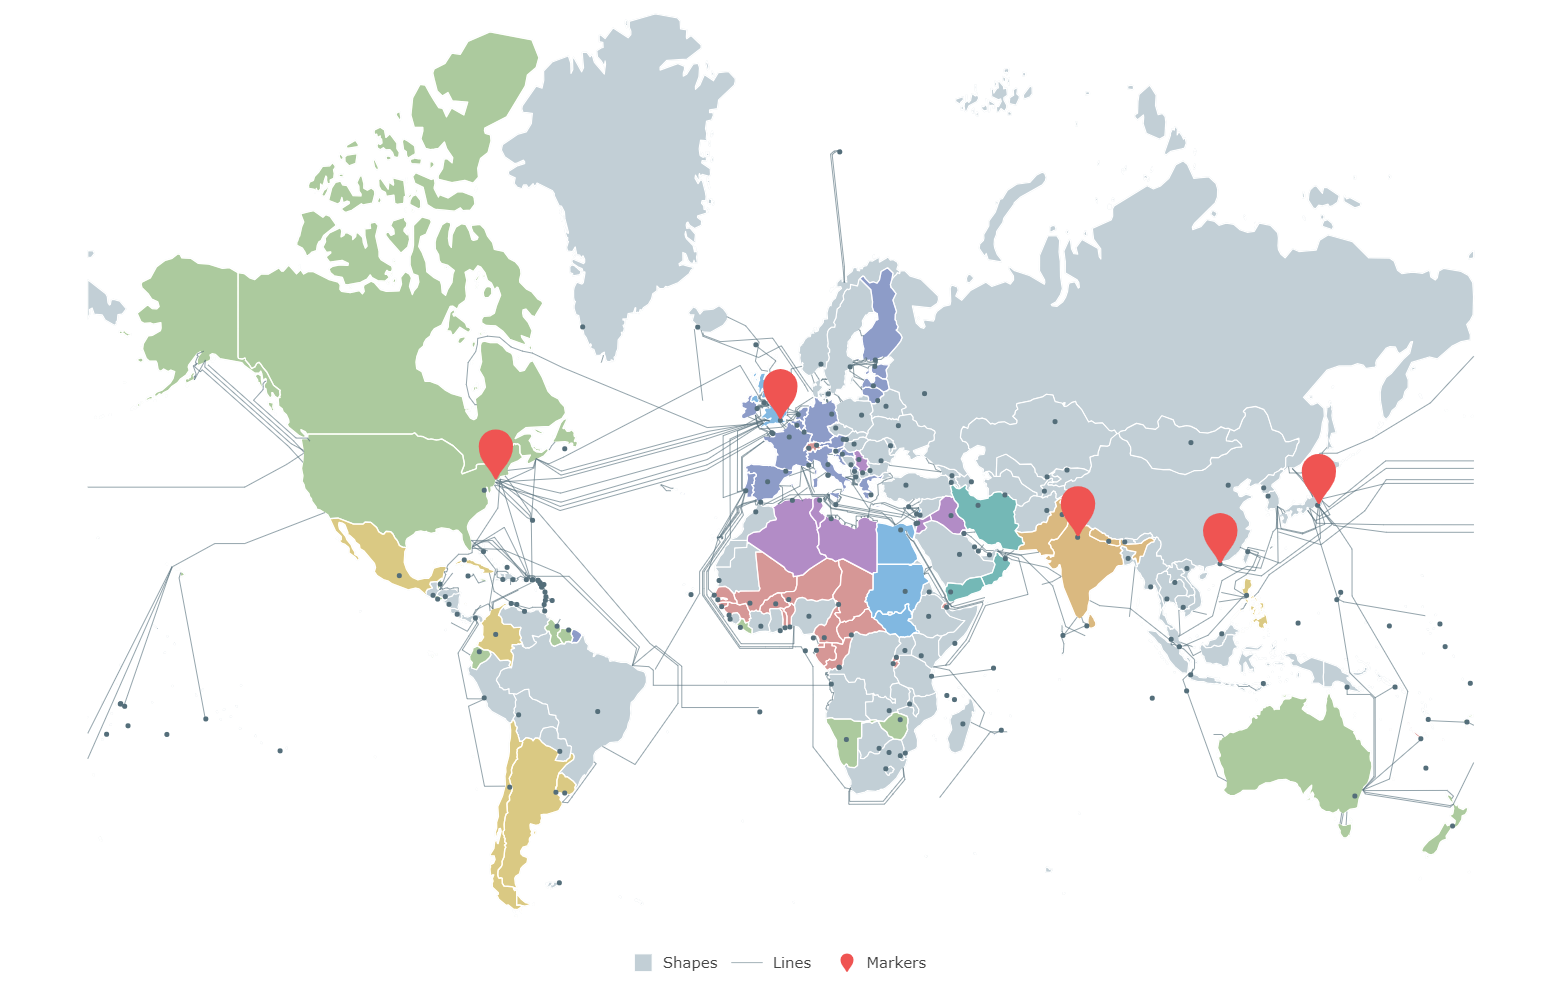
Map Series for Geographic Areas
Maps allow displaying data related to geographic regions, either with a fixed colour for each series, or by using a colour scale.
See this documented here and illustrated below.
Map Series for Routes and Connections
The map allows visualising routes as lines, or show connections between two fixed points. Additional information can be displayed by varying the colour or width of each line.
See this documented here and illustrated below.
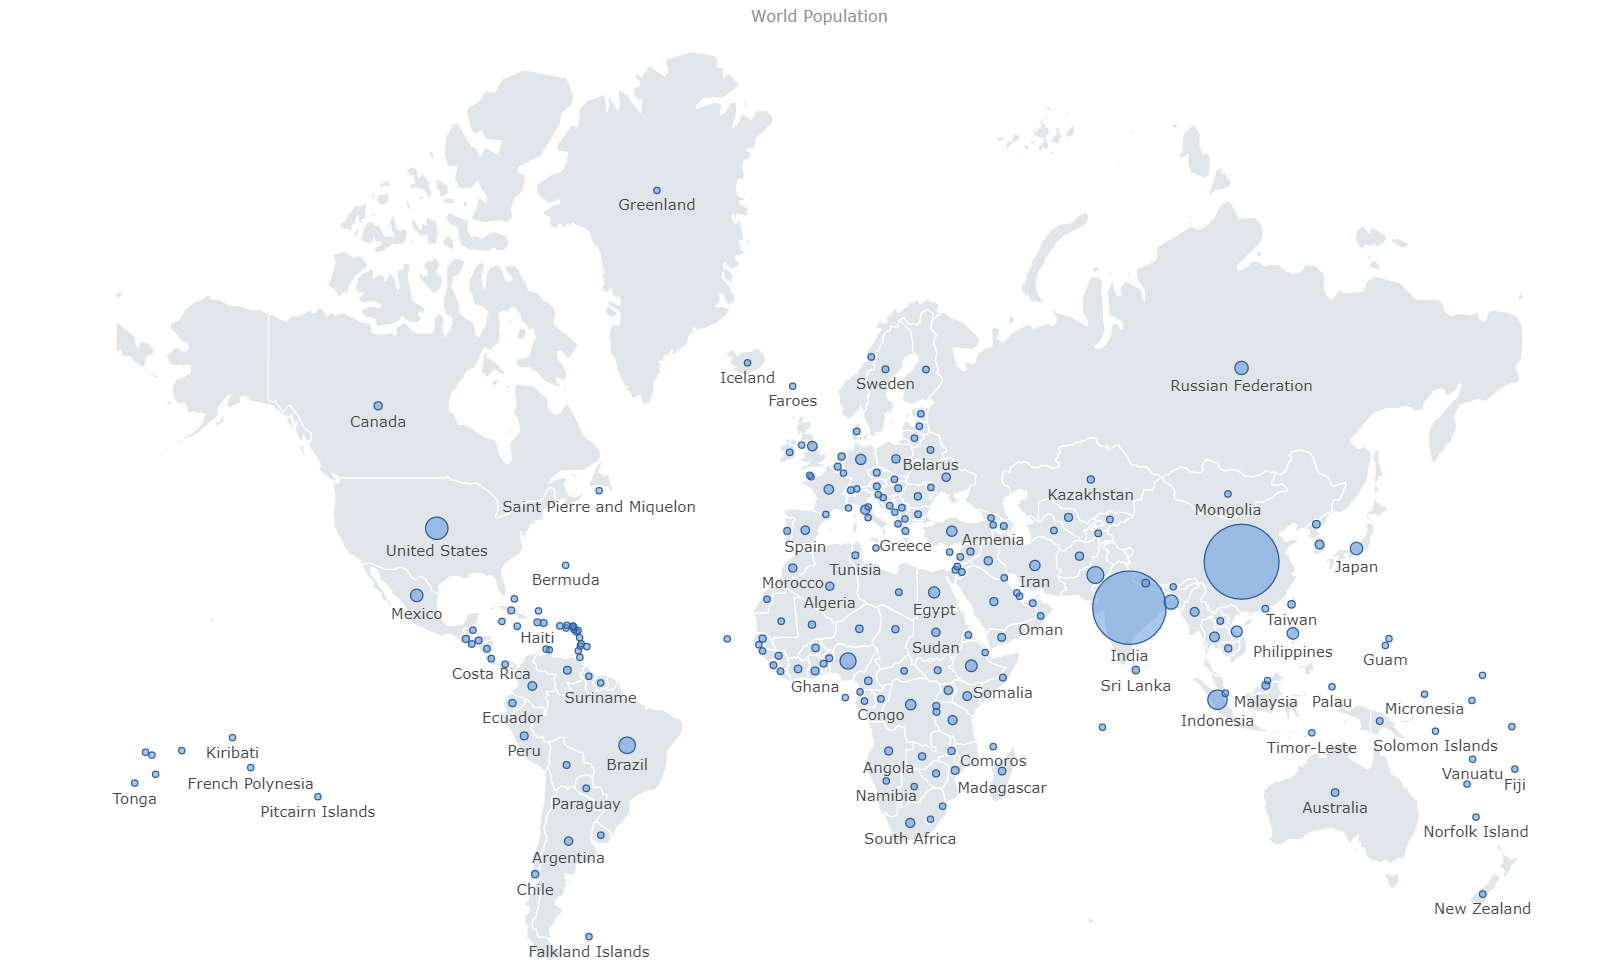
Map Series for Markers and Points Of Interest
Maps allow denoting specific geographic locations using markers. These can be customised to any shape, and also sized proportionally to the associated datapoint.
See this documented here and illustrated below.
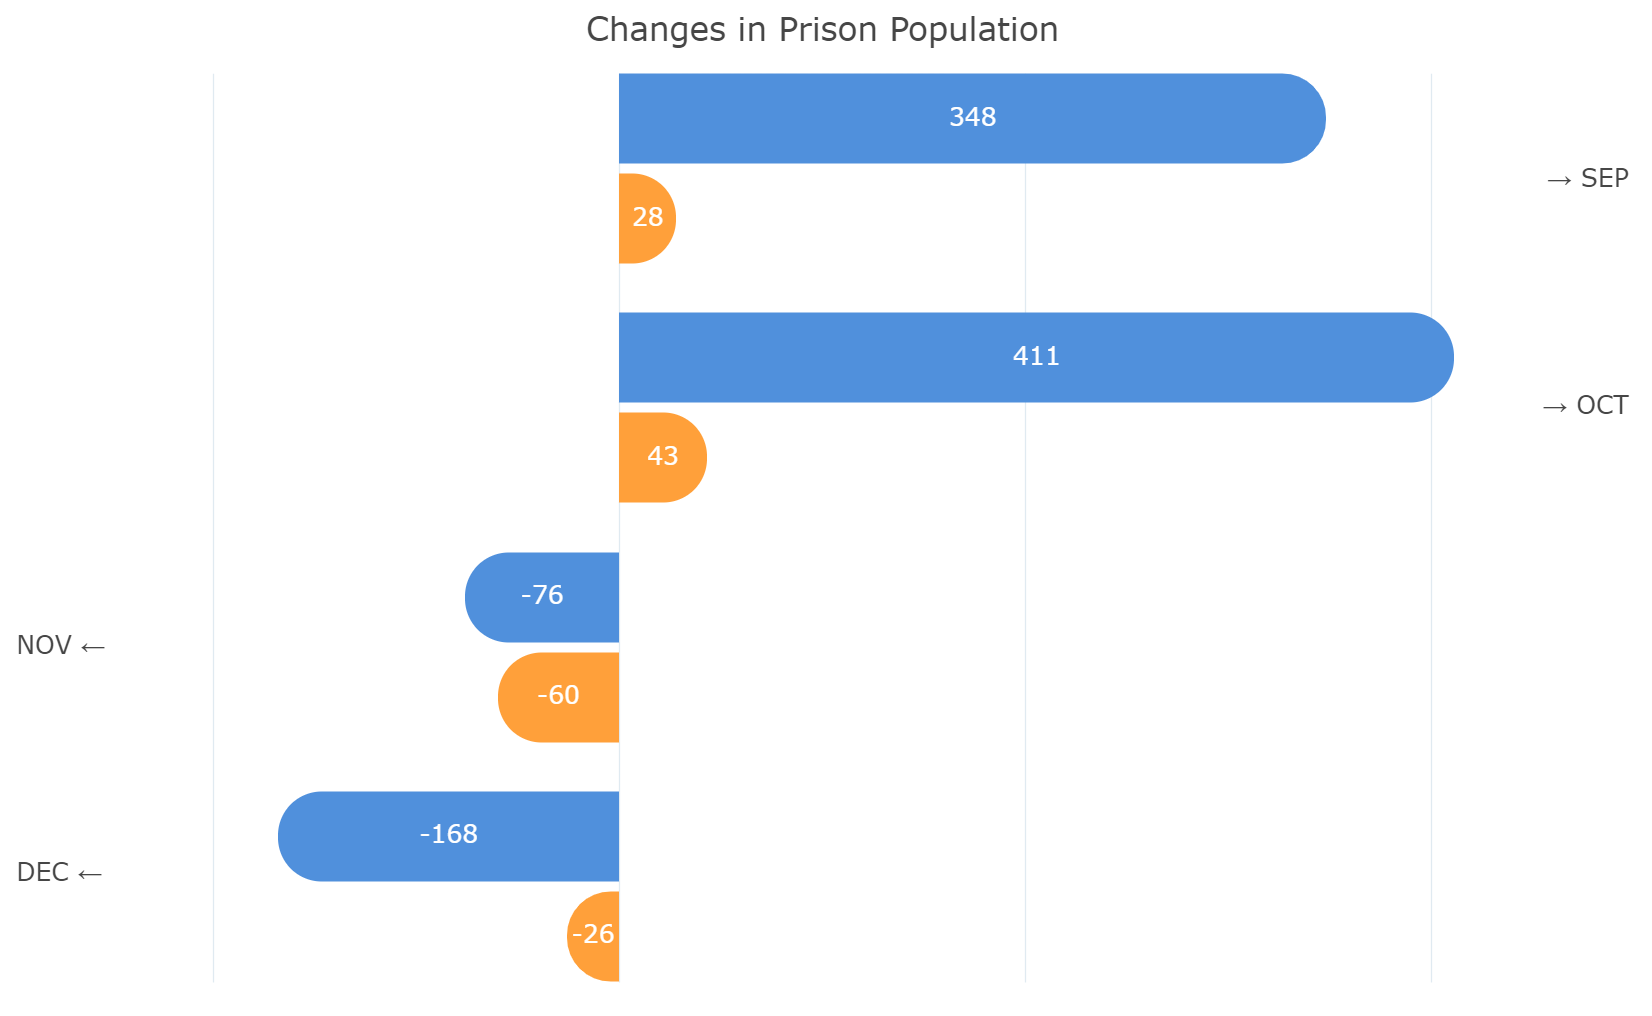
Rounded Corners for All Bar Series
It is now possible to display rounded corners for the Bar, Range-Bar, Histogram and Boxplot series. This helps deliver a customized and streamlined appearance of your charts.
See this documented here and illustrated below.
Summary
AG Charts 9.2 is an important minor version - it adds new Map Series types for visualising geographic data. In addition, there are many improvements in performance, stability and quality of existing features.
If you're upgrading from a previous version of AG Charts, we recommend reviewing the release notes when planning to update. You can also see the full list of changes in our changelog.
As always, we’re keen to help you upgrade and to hear your feedback.
Happy coding!