
AG Grid 31.2 is an important minor version - it enriches and redesigns the integrated charting experience and adds key improvements to Excel export, tooltips and theming along with accessibility and performance:
1. Integrated Enterprise Charts Menu Redesign
2. Automatically Display Tooltips for Truncated Text Values
3. Exporting Grid Content as a Formatted Excel Table
4. Dark Mode for Material Design Theme
5. Figma Design System includes Material Design Theme
Please note that AG Grid 31.2 has no breaking changes from AG Grid 31. We're providing Codemods to help you update any deprecated API members with their replacement members automatically. Please review the migration guide when planning to update to this version.
Integrated Enterprise Charts Menu Redesign
The Integrated Chart Menu has been completely redesigned to improve the user experience and add new features such as switching Categories/Series, setting aggregations and using the Time Axis.
The redesigned Data Panel now shows clearly the data requirements of the extensive chart range of Integrated Charts.
AG Grid 31.2 also adds a new Advanced Settings modal that allows the users to change Interactivity settings to their liking, as shown below:
See "Installing Integrated Charts" for more details.
Automatically Display Tooltips for Truncated Values
AG Grid 31.2 automatically displays the complete value in a tooltip when it is truncated inside RichSelectCellEditor, SelectCellEditor and built-in dropdowns.
In order to display tooltips for grid cells and column headers as well as the columns and filter tool panel where the columns are listed, you need to set the tooltip in the column definition. However, you now have the option to only display tooltips showing the full text in case the text is truncated. This way the grid reduces clutter and displays the full value only when needed.
If you're using custom cell renderers, column header or group column header components, you can now control whether a tooltip is displayed and what value is shown in the tooltip.
See this documented here and demonstrated below:
Exporting Grid Content as a Formatted Excel Table
AG Grid 31.2 allows exporting grid rows as a formatted Excel table. This adds important features in the Excel spreadsheet - naming the table of values, displaying rows/columns with alternating background colors, highlighting columns and activating column filtering. This helps format the exported data and makes it easier to use.
See this documented here and demonstrated below:
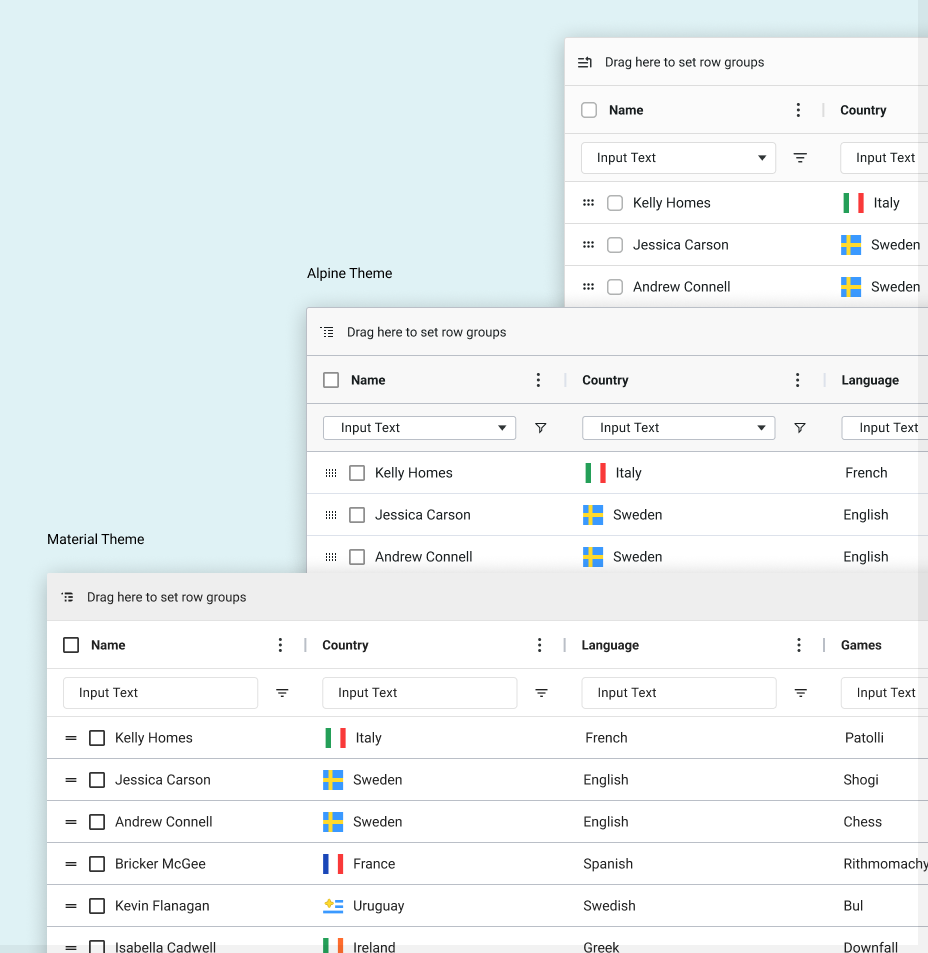
Dark Mode for Material Design Theme
AG Grid 31.2 adds a dark mode for the Material Design theme. This will help you use the theme more widely in your applications and provide the dark mode experience for your end-users.
Figma Design System includes Material Design Theme
AG Grid 31.2 adds the Material theme to the Figma Design System. This allows you to use the Material theme in your Figma designs and to easily compare appearance across themes along with the rest of your design.
See this illustrated below:
Summary
AG Grid 31.2 is a minor version with key features - it adds new capabilities to integrated charting and redesigns the chart menu UI, along improvements to Excel export, tooltips, accessibility and stability.
We suggest reviewing the migration guide when planning to upgrade and seeing the full list of changes in our Changelog.
As always, we’re keen to help you upgrade and to hear your feedback.
Happy coding!