
This tutorial is designed to show you how to update AG Charts in real-time (every 10ms) as well as in response to user interaction. By the end of the tutorial, you'll have a chart that looks like this:
This tutorial is focused on React, but we have source code available for JavaScript and Angular as well.
Project Setup
The first thing we need to do is configure our project. Let's start by creating a new React app using vite, and then installing the neccessary dependencies:
npm create vite@latest ag-charts-realtime-updates-demo -- --template react
cd ag-charts-realtime-updates-demo
npm install
And then we can install the AG Charts React library:
npm install ag-charts-react
Generating Data
Before building a chart, we need some data to display within it. Take a look at the dataset below which contains an array of products and their associated price data. Each object in this array will represent a category on the x-axis (product) and each property (previous, current, pl1, pl2) will be plotted as a bar on the y-axis:
[
  {
    "product": "Cobalt",
    "previous": 10817.55,
    "current": 27893.21,
    "pl1": 23667.47,
    "pl2": 16694.04
  },
  {
    "product": "Rubber",
    ...
  }
  ...
]
Next, in order to update the data displayed within the chart in real-time, we'll need a way of generating data on the fly. To keep things simple, we've pre-built this logic for you. All you need to do is download the DataGenerator.js file below and add it to your project:
Of course, you can review the source code if you like, but the important thing to take away here is that we can call createNewDataSet() to create a new dataset with updated pricing data for each product.
Creating the Chart
Now that we have our project setup, and a way to generate data on the fly, we can start to implement our chart.
The first thing to do is create a new PriceChart.jsx component and import AgChartsReact, as well as the createNewDataSet utility method.
import React, { useState } from "react";
import { AgChartsReact } from "ag-charts-react";
import createNewDataSet from "./DataGenerator";

export default function PriceChart() { }
Next, create a chartOptions variable (which will be used to configure and update the chart) and return the <AgChartsReact /> component, passing the chartOptions object via the options property:
export default function PriceChart() {
  const [chartOptions, setChartOptions] = useState({});
  return (<AgChartsReact options={chartOptions} />)
}
Then, we can render this new component within our root element in index.js:
import React from "react";
import ReactDOM from "react-dom/client";
import PriceChart from "./PriceChart";

const root = ReactDOM.createRoot(document.getElementById("root"));
root.render(<PriceChart />);
Configuring the Chart
Now we have the bare-bones of a chart, we need to configure it for our application. Add the following properties into the chartOptions object:
const [chartOptions, setChartOptions] = useState({
  title: { text: "Price Data" },
  subtitle: { text: "December 1st, 2023" },
  theme: "ag-vivid-dark",
  height: 750,
  data: createNewDataSet()
  series: ["previous", "current", "pl1", "pl2"].map(
    (yKey) => ({
      type: "bar",
      xKey: "product",
      yKey: yKey
    })
  ),
}
Let's break-down each of these properties and explain what they're doing:
title,subtitle: Text to be displayed at the top of the chart.theme: Preset styles to apply to the chart. We've chosenag-vivid-darkbut you can choose another from our list of themes, if you prefer.height: By default, the chart will automatically resize to fill its container element. By specifyingheight: 750we're enforcing the height of our chart, regardless of its container size. Because we haven't specified a width, the chart will fill its container element (which is 100% in this case).data: The dataset to be visualised in the chart, which is being dynamically generated by thecreateNewDataSetmethod.series: An array of series, created by looping through our price metrics, which results in 4 bars per product - one for each price metric.
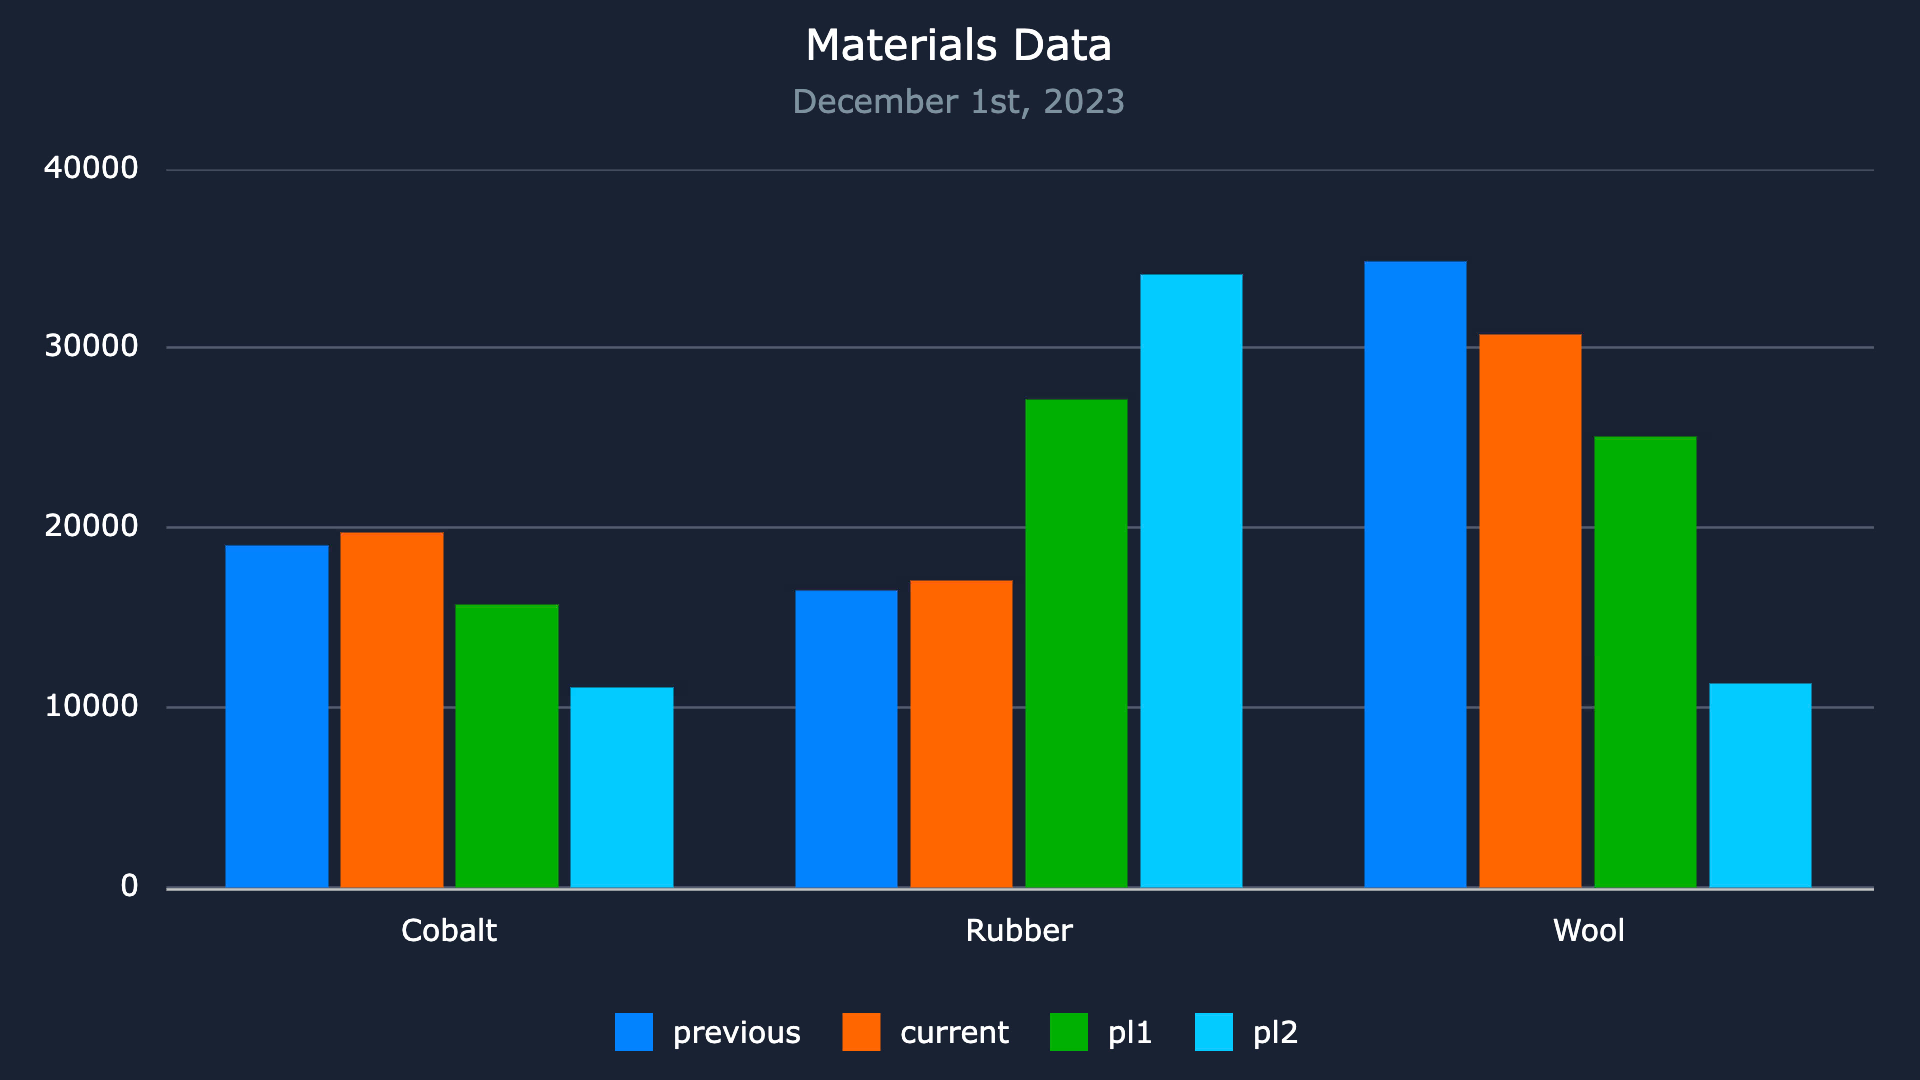
Running the chart at this point should show a bar chart with 6 data-points plotted on the y-axis for each product on the x-axis:
Updating the Chart
Now we have a fully configured chart, we can start to trigger updates to the data in real-time.
Updating charts is very easy - all we need to do is clone, mutate and update the chartOptions object and the chart will automatically process any changes:
// Update Chart Data
const updateStockPrices = () => {
  setChartOptions((currentOptions) => ({
    ...currentOptions,
    data: createNewDataSet(),
  }));
};
We can then use setInterval to call updateStockPrices() every 10ms. We'll do this in a useEffect hook with an empty dependency array to trigger this when our chart is rendered:
useEffect(() => {
  let interval = setInterval(() => {
    updateStockPrices();
  }, 10);
  return () => clearInterval(interval);
}, []);
And that's it, you should now have a chart that updates every 10ms:
Handling User Interaction
The last thing we'll cover in this tutorial is updating the chart in response to user interaction. To demonstrate this, we'll add two buttons that will toggle the chart between horizontal/vertical orientations, and stacked/grouped bars.
We'll start by implementing the button to toggle between stacked/grouped bars.
All we need to do is implement a function that updates our chartOptions object to include the stacked property and assign its value:
const toggleStacked = () => {
  setChartOptions((currentOptions) => ({
    ...currentOptions,
    series: currentOptions.series.map((seriesItem) => ({
      ...seriesItem,
      stacked: !seriesItem.stacked,
    })),
  }));
};
And then add a button to our component that calls this function:
return (
  <>
    {/* Chart Controls */}
    <div>
      <button onClick={toggleStacked}>
        {chartOptions.series[0].stacked ? "Group" : "Stack"}
      </button>
    </div>
    {/* Chart component */}
    <AgChartsReact options={chartOptions} />
  </>
);
The logic for rotating the chart is the exact same: Create a function to toggle the value of the direction property, and add a button to call this function:
// Rotate Chart
const rotateDirection = () => {
  setChartOptions((currentOptions) => ({
    ...currentOptions,
    series: currentOptions.series.map((seriesItem) => ({
      ...seriesItem,
      direction:
        seriesItem.direction === "horizontal" ? "vertical" : "horizontal",
    })),
  }));
};

return (
  <>
    {/* Chart Controls */}
    <div>
      <button onClick={rotateDirection}>{"Rotate"}</button>
      <button onClick={toggleStacked}>
        {chartOptions.series[0].stacked ? "Group" : "Stack"}
      </button>
    </div>
    {/* Chart component */}
    <AgChartsReact options={chartOptions} />
  </>
);
Summary
Congratulations! You've completed the tutorial and now have a chart that updates in real-time, and in response to user input. To summarise, we've:
- Created and configured a multi-series chart with AG Charts
- Triggered updates to a chart in real-time (
10ms) - Configured buttons to trigger changes to the chart based on user input
Want to learn more? Check-out our docs at https://charts.ag-grid.com/react/api-create-update/