
AG Studio is a JavaScript component for building self-service dashboards that embeds in your application like anything else you've built. It uses your design system, sits inside your auth, and your data never leaves your infrastructure - even when using our AI assistant.
Version 2.0 gave users more ways to slice their data and gave developers more control over the experience they ship. Version 2.1 focuses on what happens when a dashboard meets the rest of the business: multi-dimensional analysis at any data volume, AI agents that you can customise to your workflows, output your users can hand to someone else, and an interface everyone can use.
Key features in AG Studio 2.1 - JavaScript embedded analytics
- AI Custom Agents: Rewrite instructions, restrict tools, or add your own specialist agents.
- Pivot & Hierarchical Widgets: Pivot tables, treemaps and sunbursts for multi-dimensional analysis.
- Server-Side Pivot: Push cube-shaped queries down to your own backend.
- Printing & PDF Export: A print layout mode for physical copies and PDFs.
- Accessibility: WCAG 2.1 AA, screen reader support, and a high contrast theme.
AI custom agents
AG Studio's AI assistant knows everything about building dashboards and nothing about your business. Ask it for a breakdown of revenue, and it will happily reach for a pie chart, even if your team decided three years ago that revenue is only ever shown as a column chart.
In version 2.0, we exposed AG Studio's built-in AI commands as standalone units you could plug into your own harness. Version 2.1 goes one level up: you can now modify the agents themselves.
An agent is defined by a type, a schema for its parameters, and a config factory that returns its name, instructions, and the tools it is allowed to use. Instructions are a function of the studio API, so an agent can read live dashboard context through api.getAiContext() rather than relying on a static prompt:
const chartBuilder: AgAiAgent = {
    type: 'chart-builder',
    description: 'Explores the data and builds bar charts.',
    schema: (s) => s.undefined(),
    config: () => ({
        name: 'Chart Builder',
        instructions: (api) => {
            const { tables } = api.getAiContext().schema();
            return `You are a bar-chart specialist...`;
        },
        tools: [
            { name: 'view_schema' },
            { name: 'execute_query' },
            { name: 'add_widget' },
            { name: 'configure_widget' },
            { name: 'position_widget' },
        ],
    }),
};
Agents are supplied through the ai property, with primaryAgent deciding which one starts the conversation. Spread agStudioDefaultAgents into the array to keep the built-in behaviour alongside your own, or leave it out to replace it entirely:
import { agStudioDefaultAgents } from 'ag-studio';

const ai = {
    executeTurn,
    agents: [ chartBuilder, ...agStudioDefaultAgents ],
    primaryAgent: 'chart-builder',
};

<AgStudio ai={ai} />
Because the tools array is the only capability an agent has, restricting it is a hard boundary rather than a suggestion in a prompt. An agent without add_widget cannot add a widget, however it is asked. Agents can also delegate to each other via delegateAgents, so a router agent can hand off to specialists per domain.
Pivot & hierarchical widgets
Some questions need two dimensions at once. Sales by region is a bar chart; sales by region and channel, with subtotals, is a pivot table. It's the shape finance teams have worked in for decades, and is now available in Studio 2.1 with the introduction of pivot tables.
Users drop fields into Rows, Columns and Values, and AG Studio aggregates each measure for every row and row-column cell, with optional total rows & columns:
Like every other widget, pivot tables can be preconfigured and shipped as a ready-made option:
dataMapping: {
    rows: [{ id: 'stores.region' }, { id: 'products.subcategory' }],
    columns: [{ id: 'orders.channel' }],
    values: [{ id: 'net_sales' }, { id: 'gross_sales' }],
}
Hierarchical widgets
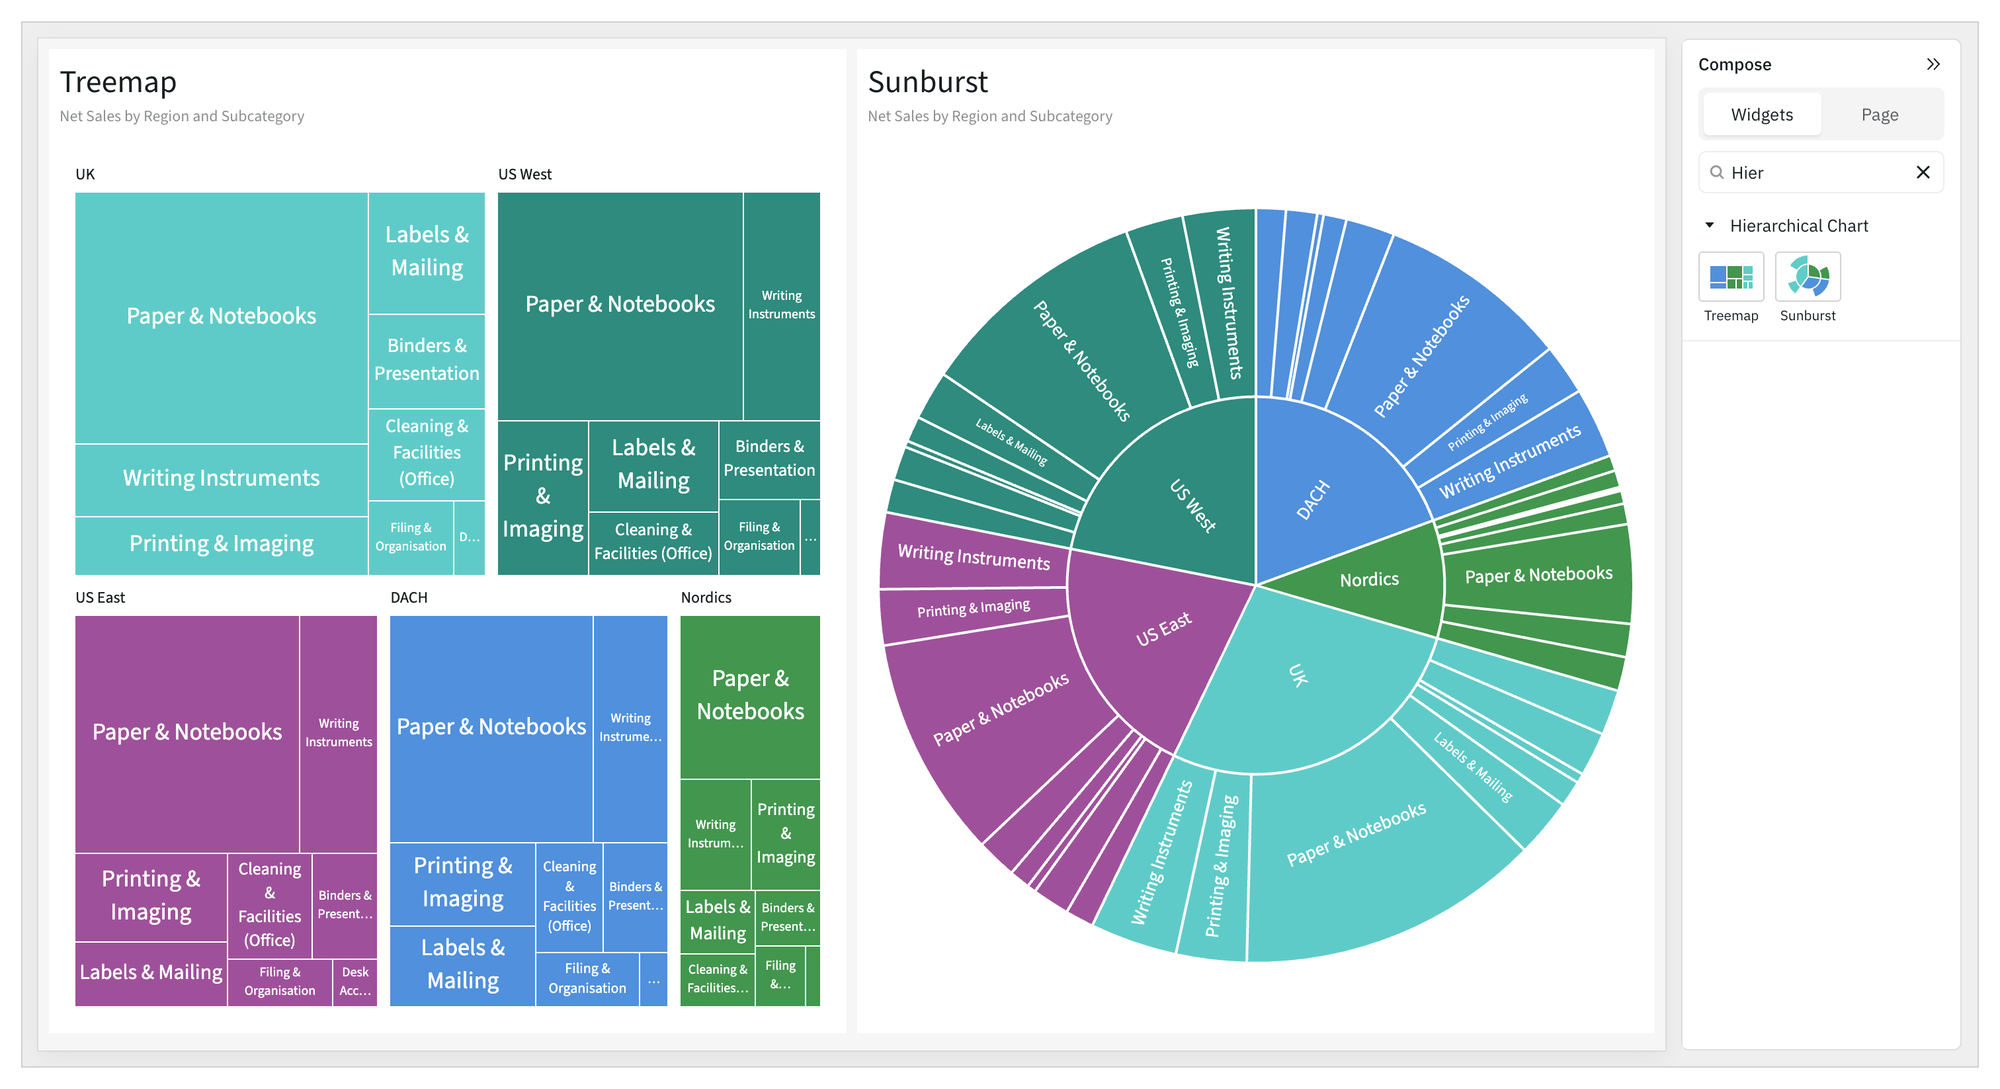
AG Studio 2.1 also adds two hierarchical charts - treemap and sunburst - for showing part-to-whole proportions across several levels of grouping at once. Hierarchy levels nest from the outside in, a value field sizes each tile or segment, and an optional colour field applies a colour scale on top:
dataMapping: {
    categoryKey: [{ id: 'stores.region' }, { id: 'products.subcategory' }],
    valueKey: [{ id: 'net_sales' }],
    colorKey: [{ id: 'gross_margin_percentage' }],
}
Server-side pivot
Server-Side Data moves query execution from the browser to your own backend. Studio calls your engine's execute() method with one or more AgExecuteRequest objects. Each request carries an AgStudioQuery that your engine translates into your backend's native query language, and returns one AgExecuteResult per request, in the same order.
Some widgets, like the pivot table above, need cube-aggregated data that execute() can't express: multiple independent grouping axes with dense cell coverage, and subtotal placement within a hierarchy. To support this, AG Studio 2.1 adds a second, optional execution method: executeCube(...requests: AgCubeResolvedExecuteRequest[]), and expects one AgCubeResult per request:
class CustomDataEngine implements AgDataEngine {
    // Flat row queries
    async execute(
        ...requests: AgExecuteRequest<AgResultShape>[]
    ): Promise<AgExecuteResult[]> {
        return Promise.all(requests.map((r) => this.executeOne(r)));
    }

    // New in 2.1: cube-shaped results for pivots and hierarchies
    async executeCube(
        ...requests: AgCubeResolvedExecuteRequest[]
    ): Promise<AgCubeResult[]> {
        return Promise.all(requests.map((r) => this.executeCubeOne(r)));
    }
}
Each request carries the query's axes, measures and filter, and you return one AgCubeResult per request: the axes in query order, the measure descriptors, and a sparse cell store keyed by axis-tuple index.
interface AgCubeResult<TValue = AgPrimitive> {
    dataShape: 'cube';
    axes: AgResultAxis[];
    measures: AgResultMeasure[];
    cells: AgCubeCells;
    metadata: AgResultMetadata;
}
executeCube is optional, and AG Studio degrades predictably without it. Pivot tables, treemaps and sunbursts drop out of the widget picker with a validation warning, and charts with a legend field still render, just without the legend grouping - legend grouping is a pivot query underneath.
→ Pivot and hierarchy queries docs
Printing & PDF export
Dashboards don't stay on screen. They end up in board packs, client reports or emails, and the people who need them are rarely the people with a login.
AG Studio 2.1 now supports PDF exports via the browser's print dialogue. Only the content will be exported, and the remaining UI (compose, data, filter, & AI panels) will be hidden, allowing you to export your reports and share them with anyone:
For best results, we recommend configuring the page's layout to match your target paper size and margins. The AG Studio layout is measured in pixels, and a conversion factor of 96 pixels per inch is used. Configuring a landscape A4 report (297 x 210mm) looks like this:
const pageState = {
    layout: {
        minWidth: 1123,
        maxWidth: 1123,
        height: 794,
        pagePadding: 96,
    },
};
To make printing easier, you can also preconfigure the browser's print settings to match with an @page rule, so your users aren't left choosing paper sizes from a dropdown:
@page {
    size: A4 landscape;
    margin: 96px;
}
Accessibility
Version 2.0 introduced keyboard shortcuts and described them as a building block towards making AG Studio fully accessible. Version 2.1 is the rest of that work.
AG Studio now targets WCAG 2.1 level AA, the standard most accessibility regulations - including Section 508 and the ADA - are written against.
More specifically, AG Studio now supports:
- Keyboard operation across the canvas, the widget configurator and the filters panel. Every action that can be performed by dragging has a keyboard equivalent, in compliance with WCAG 2.2 Success Criterion 2.5.7 (Dragging Movements).
- Screen readers, which are tested with JAWS on Windows and VoiceOver on macOS. All controls now expose their name, role and state, and changes are announced through a live region in the current interface language.
The theme builder also now ships a High Contrast preset in both light and dark modes, with high-contrast text, clear focus indicators and a colour-blind-safe chart palette.
Summary
AG Studio 2.1 is about giving your users more ways to view their data, wherever it resides, as well as making it easier to get reports in front of the right people:
- Pivot tables and hierarchical charts add the multi-dimensional analysis that finance and operations teams expect,
- Server-side pivot means those widgets work whether your data lives in a JavaScript array or a warehouse.
- Custom agents let you shape the AI assistant around your domain instead of accepting a general-purpose one.
- Print layout gets reports to the people who will never log in,
- Our accessibility work gets them to the people who couldn't use them before.
Together, these changes widen the audience for what you ship: more analytical shapes, more data volumes, and more users who can actually use it.
What's next
The AG Studio team are continuing to expand its capabilities, focusing on deeper AI integration, richer widget types, and broader accessibility.
If there's a specific capability you need that's not on our roadmap, we want to hear about it. Enterprise customers can reach out directly via Zendesk; everyone else can use the contact form or open a discussion on GitHub.
Get started
AG Studio is available now. Visit the AG Studio documentation to get started, or request a demo to see it in action with your data.