

AG Charts 14 is our latest major release, with significant enhancements to both data handling and visualisation.
For data handling, AG Charts simplifies working with external, paginated APIs by introducing async data loading, which is particularly useful when zooming into or scrolling through large datasets - instead of loading all of your data upfront, you can pass through smaller chunks of data in response to users' interactions. We've also expanded the data types we support out of the box to include BigInt and ISO 8601 date strings, making it easier to work with high-precision numbers and dates.
To make customising your charts easier, you can now use CSS variables to define colours within AG Charts, use colour mixing to create colours based on theme parameters, and include images - emojis, flags, avatars, anything - within any text element.
Read on for demos, code snippets, and full details on what's new.
Key features
- Async data - Load and update chart data asynchronously for smoother integration with remote data sources.
- Displaying images in text elements - Embed images directly within chart labels and captions for richer, more expressive annotations.
- Improved colour options - Support for CSS variables, colour mixing of theme parameters and HSL colour codes.
- BigInt and ISO 8601 support - Native support for BigInt values and ISO 8601 date strings for more robust data handling.
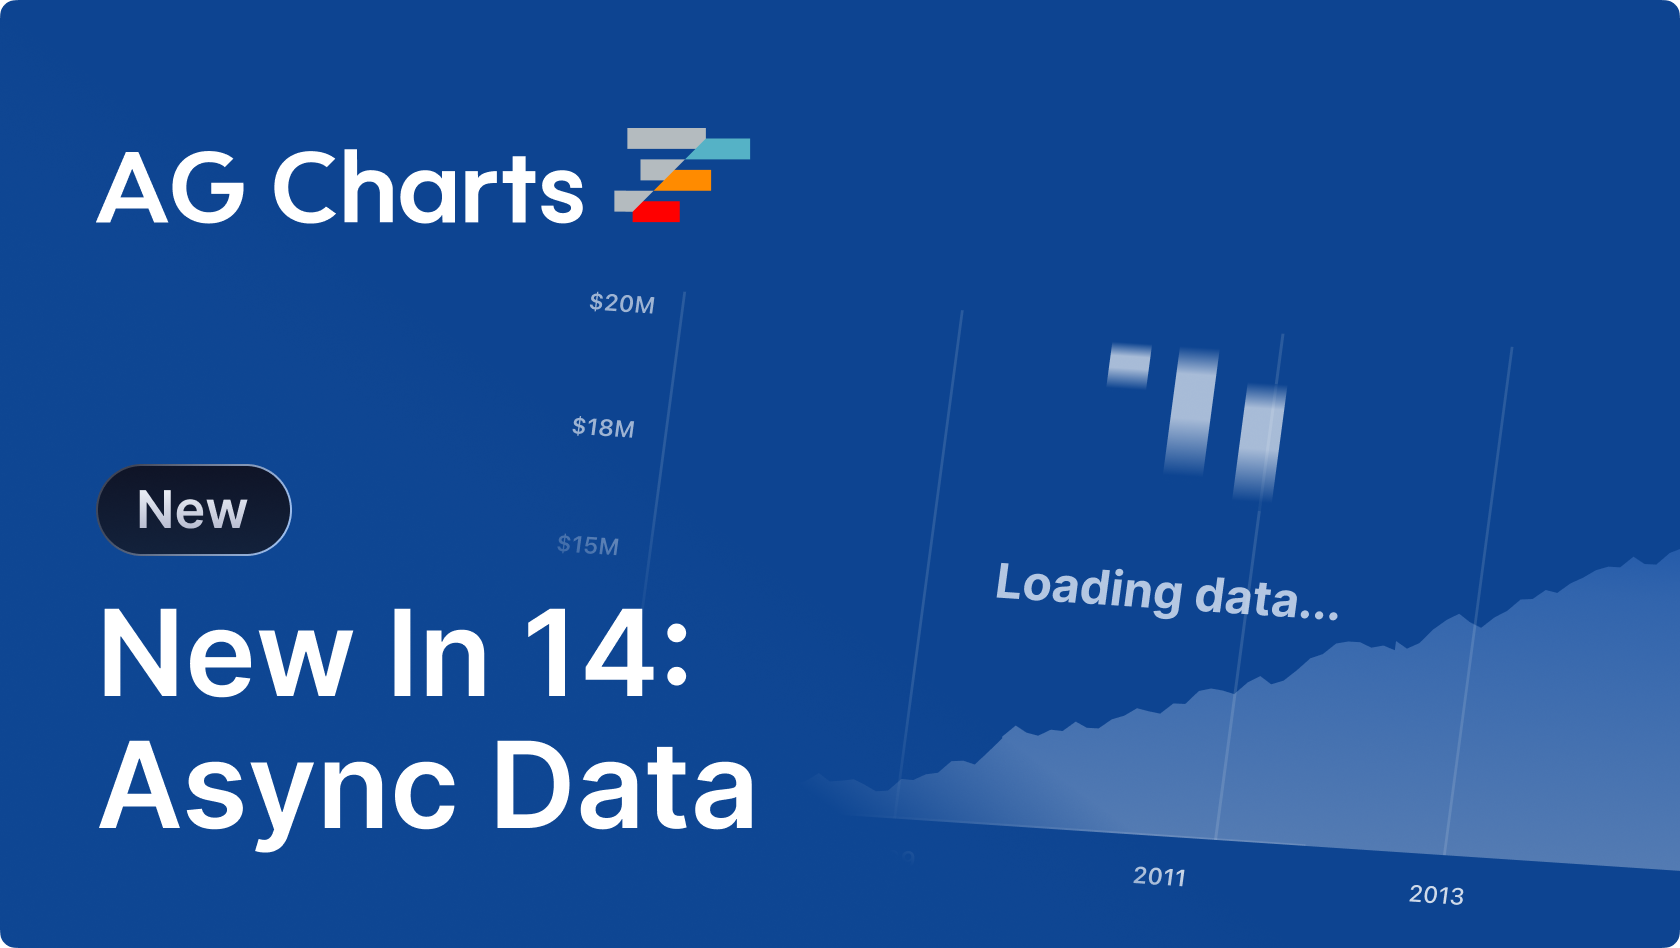
Async data
AG Charts 14 lets you load your data on demand, making it easier to integrate with your remote data sources and paginated APIs without blocking rendering.
Whilst loading, the chart automatically displays a customisable Loading Overlay - this is especially useful alongside Zoom or the Scrollbar, where you want to progressively reveal data or paginate through server-side results as the user navigates.
To enable it, use the dataSource option to provide an async getData callback. The chart calls this function whenever it needs data, and shows the loading overlay until the returned promise resolves:
{
    dataSource: {
        getData: ({ windowStart, windowEnd }) => {
            return SomeServer.get({ windowStart, windowEnd });
        },
    },
}
Visit the Async data docs for more information.
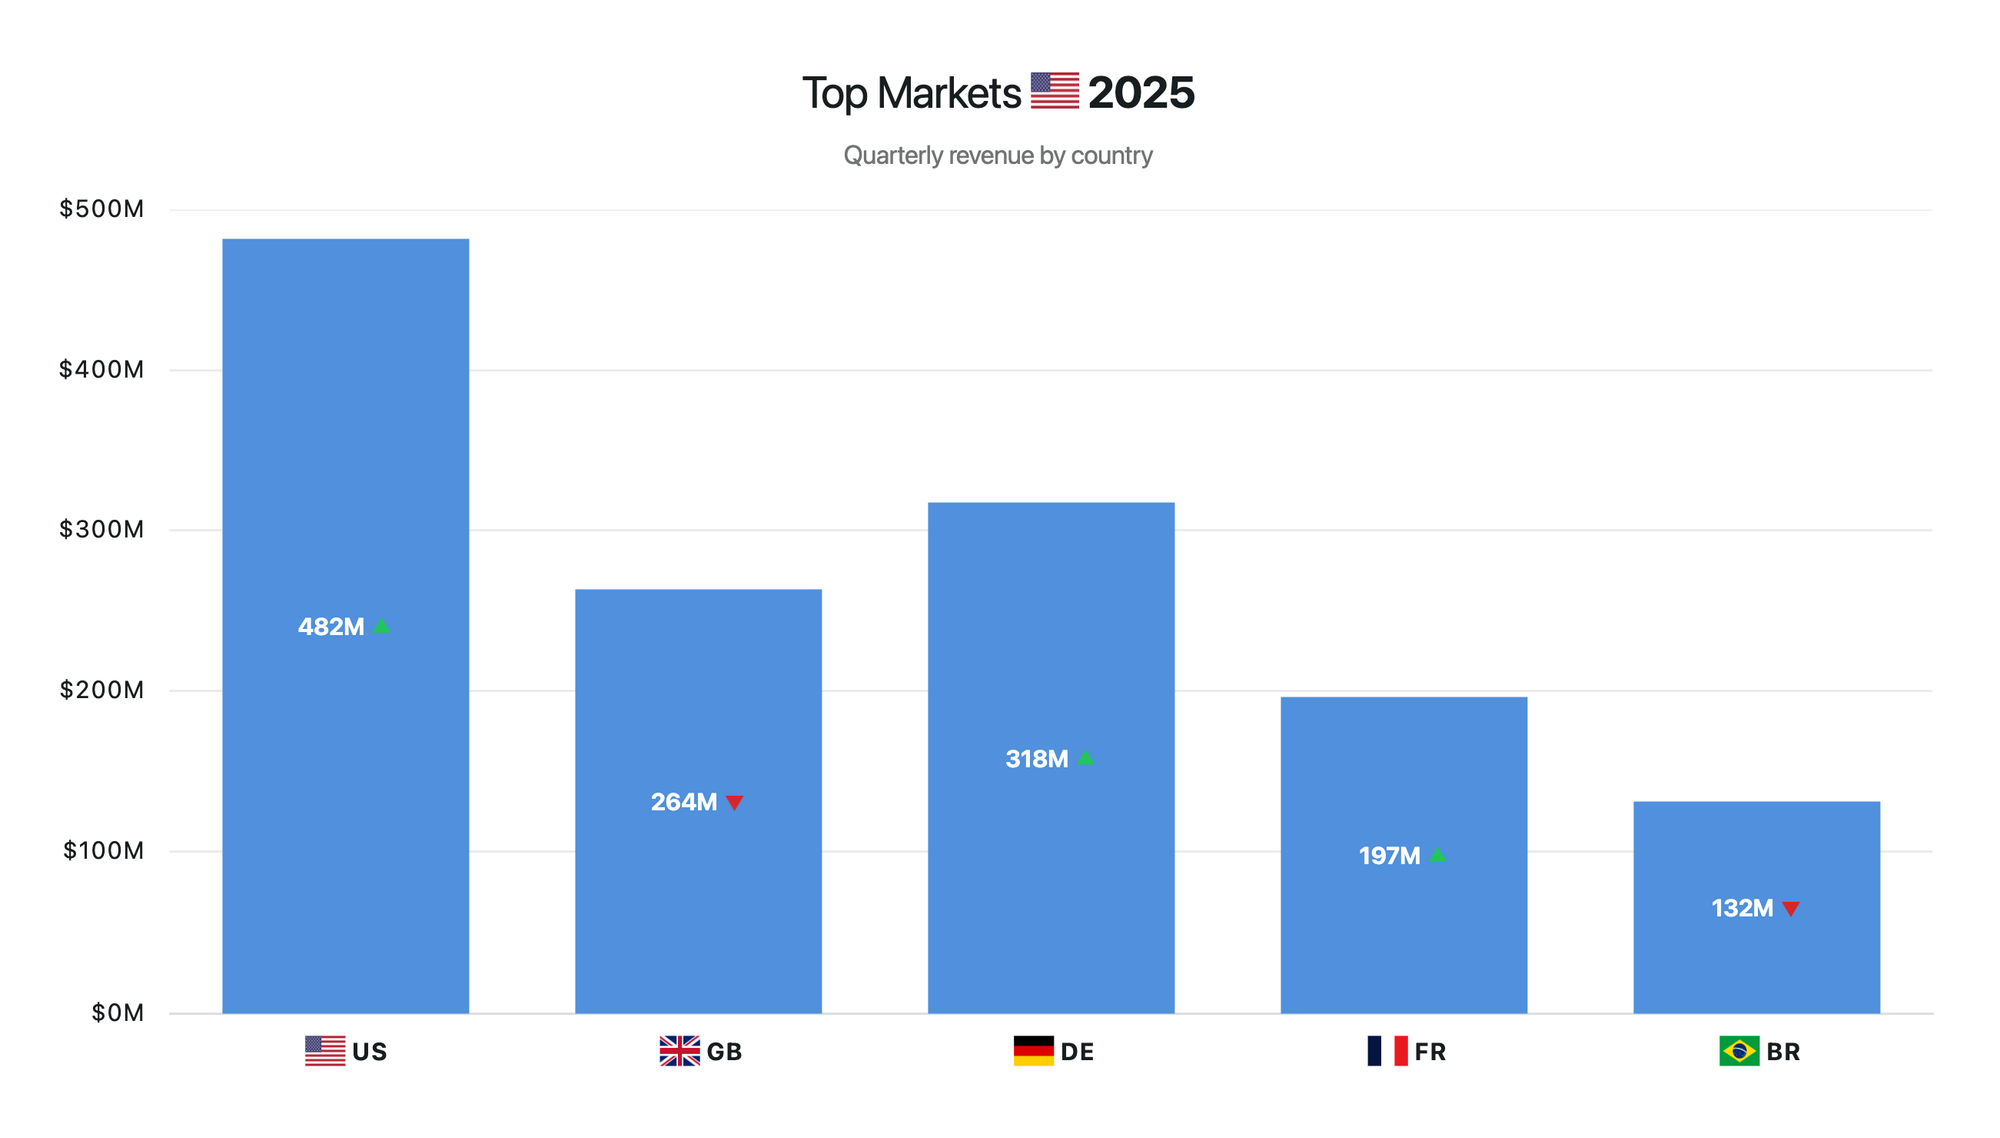
Displaying images in text elements
To help you more accurately annotate your data, you can now place images in any element that accepts text segments, including axis labels, series labels and captions. Add flags, logos, avatars or any other visual alongside descriptive text:
Images follow the same styling and positioning conventions as the rest of AG Charts, so they slot in without friction.
To add an image to a label, return a formatter that includes an object with type: image, a URL, and dimensions:
{
  axes: {
    x: {
      type: 'category',
      label: {
        formatter: ({ value }) => [
          {
            type: 'image',
            url: `${baseWWWUrl}/example-assets/flags/${value}.png`,,
            width: 20,
            height: 15,
            // ...Other formatting options
          },
          { text: ` ${String(value).toUpperCase()}`, fontWeight: 'bold' },
        ],
      },
    },
  },
}
Visit the Displaying Images and Text docs for more information.
Improved colour options
AG Charts 14 gives you more expressive control over colour across all chart types by introducing support for CSS variables, HSL colour values, and mixing options for theme parameters.
CSS variables
You can now reference CSS variables anywhere a colour is accepted. The chart will also update whenever a variable changes, making it straightforward to align your charts with an existing design system, dark mode or other global theme:
CSS Variables are passed as strings to any colour option, e.g. 'var(--background)':
{
  theme: {
    params: {
      // Access CSS variable directly
      backgroundColor: 'var(--demo-bg)',
    },
  }
},Colour mixing
Colour mixing helps you build more cohesive and adaptable chart themes from a small set of core colours. Instead of defining separate values for every fill, border, label, and interaction state, you can derive them from existing theme parameters. This reduces duplication, keeps colour relationships consistent, and makes themes easier to maintain across colour schemes, such as light and dark modes.
To mix two theme parameters, set the colour value to an object containing:
ref: the source colouronto: the background colour to blend it ontomix: the source colour’s opacity, from0to1
{
  theme: {
    params: {
      // Supply mix option on Theme Params
      foregroundColor: {
        ref: 'accentColor', mix: 0.85, onto: 'backgroundColor'
      },
    }
  }
},
In this example, accentColor is blended onto backgroundColor at 85% opacity.
HSL colour codes
HSL (Hue, Saturation, Lightness) is a cylindrical colour model designed to align with human colour perception. HSL support in AG Charts 14 makes it far easier to adjust palettes by hand, especially when compared to Hex or RGB values.
HSL colour codes are provided in the same way as other colour formats, e.g. { format: "hsl(145, 63%, 42%)", value: 25 },
const options = {
  data: [
    // Hex colours
    { format: "#4878d0", value: 30 },
    // RGB
    { format: "rgb(238, 133, 75)", value: 25 },
    // Named colours
    { format: "mediumpurple", value: 20 },
    // New: HSL
    { format: "hsl(145, 63%, 42%)", value: 25 }
  ],
}
Visit the Colours docs for more information.
Expanded data types
AG Charts already supported a range of data types, and AG Charts 14 now introduces support for BigInt and ISO 8601 date/date-time strings in your data.
BigInt support
AG Charts previously supported integer values up to ~9 quadrillion (or 2⁵³−1). That sounds large, but high-precision financial figures and nanosecond timestamps can easily exceed it, and when they do, JavaScript silently loses precision.
BigInt support means your data is passed through as-is, with no silent rounding and no need to convert values to strings as a workaround - just supply your data as-is to AG Charts:
{
    data: [
        { id: 'a', count: 1500 }, // number
        { id: 'b', count: 9007199254740993n }, // bigint
    ],
}
Visit the Data configuration docs for more information.
ISO 8601 support
Working with dates is notoriously tricky, which is why AG Charts 14 now accepts ISO 8601 date and date-time strings directly, alongside JavaScript Date objects and BigInt Unix epoch values.
This change means you no longer need to convert your strings into Date objects before passing them to AG Charts, meaning one less place for timezone bugs to creep in.
ISO 8601 strings are supplied in the same way as Date objects and Unix epoch values:
{
    data: [
        { time: new Date(2023, 0, 1), value: 50 }, // JavaScript Date
        { time: 1672531200000, value: 65 }, // Unix epoch (milliseconds)
        { time: '2023-02-01', value: 78 }, // ISO 8601 date
        { time: '2023-02-01T14:30:00Z', value: 90 }, // ISO 8601 date-time
    ],
}
Visit the Data configuration docs for more information.
Summary
AG Charts 14 focuses on expanded data handling and richer visual customisation. This release:
- Introduces async data loading for remote and live-updating datasets
- Adds support for images within chart labels
- Improves colour configuration across chart types
- Adds native support for BigInt values and ISO 8601 date strings
As always, we welcome feedback. Enterprise customers can contact us via Zendesk; Alternatively, please submit a GitHub issue or complete our contact form.
Next steps
New to AG Charts? Get started in minutes, for free, with your favourite framework:
Considering AG Grid Enterprise? Request a free 30-day trial licence to test your application in production and get direct access to our support team.
Happy coding!