
AG Charts 9.1 is an important minor release with new interactivity features for a powerful and user-friendly charting experience:
1. Synchronized Charts
2. Mini Chart in Navigator
3. Asynchronous Data Loading
4. Enterprise Charts integrated into AG Grid
As this is a minor version there are no breaking changes for anyone upgrading from AG Charts 9.0. However, we recommend reading the migration guide and reviewing the list of changes in the release notes when planning to update to this version.
Synchronized Charts
Multiple charts on a page can be synchronised to show the same axis range, zoom window and marker highlighting and crosshairs. This is particularly useful when creating dashboard style pages with multiple charts, or when stacking multiple charts which share the same axis.
This synchronisation is flexible, allowing for multiple synchronisation groups within the page, and granular control over each of the synchronizable components.
See this documented here and illustrated below.
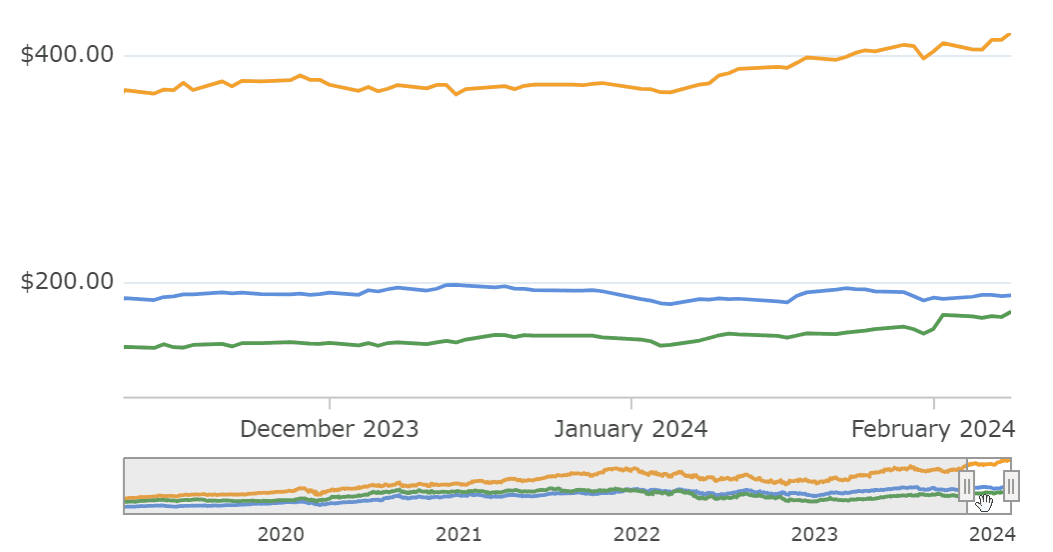
Mini Chart in Navigator
The Navigator is used to zoom and pan the displayed axis range within a chart. It is now possible to display a Mini Chart within the Navigator. This is a smaller representation of the entire chart, which supplies context to the zoomed section in the main chart, and allows users to easily find the data that interests them.
See this documented here and illustrated below.
Asynchronous Data Loading
As well as providing static data to a chart, it is now possible to use a callback function to retrieve data from a remote source. This is particularly useful when zooming into large datasets. Instead of the chart having to contain the entire dataset, it can load only the datapoints required for the currently viewed window using asynchronous data loading. This delivers a more responsive user experience and smaller loading times.
See this documented here and illustrated below.
Enterprise Charts integrated into AG Grid
AG Grid 31.1 brings an update to Integrated Charts that unlocks all AG Charts Enterprise features. It now has an expanded chart range that includes Polar, Statistical, Hierarchical, and Specialised series. This update also brings new interactivity features such as Context Menu, and Animation. Try out the seamless Integrated Charts solution on our Demo page.
See this documented here and use the power of the AG Grid integrated charts along with the AG Charts Enterprise library for the ultimate data visualisation experience:
Summary
AG Charts 9.1 is an important minor version - it adds many Enterprise features for a more powerful and interactive user experience. In addition, there are many improvements in performance, stability and quality of existing features.
If you're upgrading from a previous version of AG Charts, we recommend reviewing the release notes when planning to update. You can also see the full list of changes in our changelog.
As always, we’re keen to help you upgrade and to hear your feedback.
Happy coding!