
- Why are there so many terms for table and grid components?
- Web Terminology Overlap between Grid and Table
- What is the difference between a Data Grid and a Data Table?
- Data Grids as a Table Replacement
- Customising Data Grids and Data Tables
- What Features Do Data Grids And Data Tables Have In Common?
- What Data Grid Features Does a Data Table Tend to Lack?
- Should you write your own Data Grid?
- Spreadsheet like interactivity vs. Rendering Data vs. Layout
- AG Grid is a Data Grid
Why are there so many terms for table and grid components?
When describing components in English, we might use the terms "Data Grid", "Data Table", "Table" and "Grid" interchangeably. When describing web components, the words can often be confused because of their overlap with existing web technology terms.
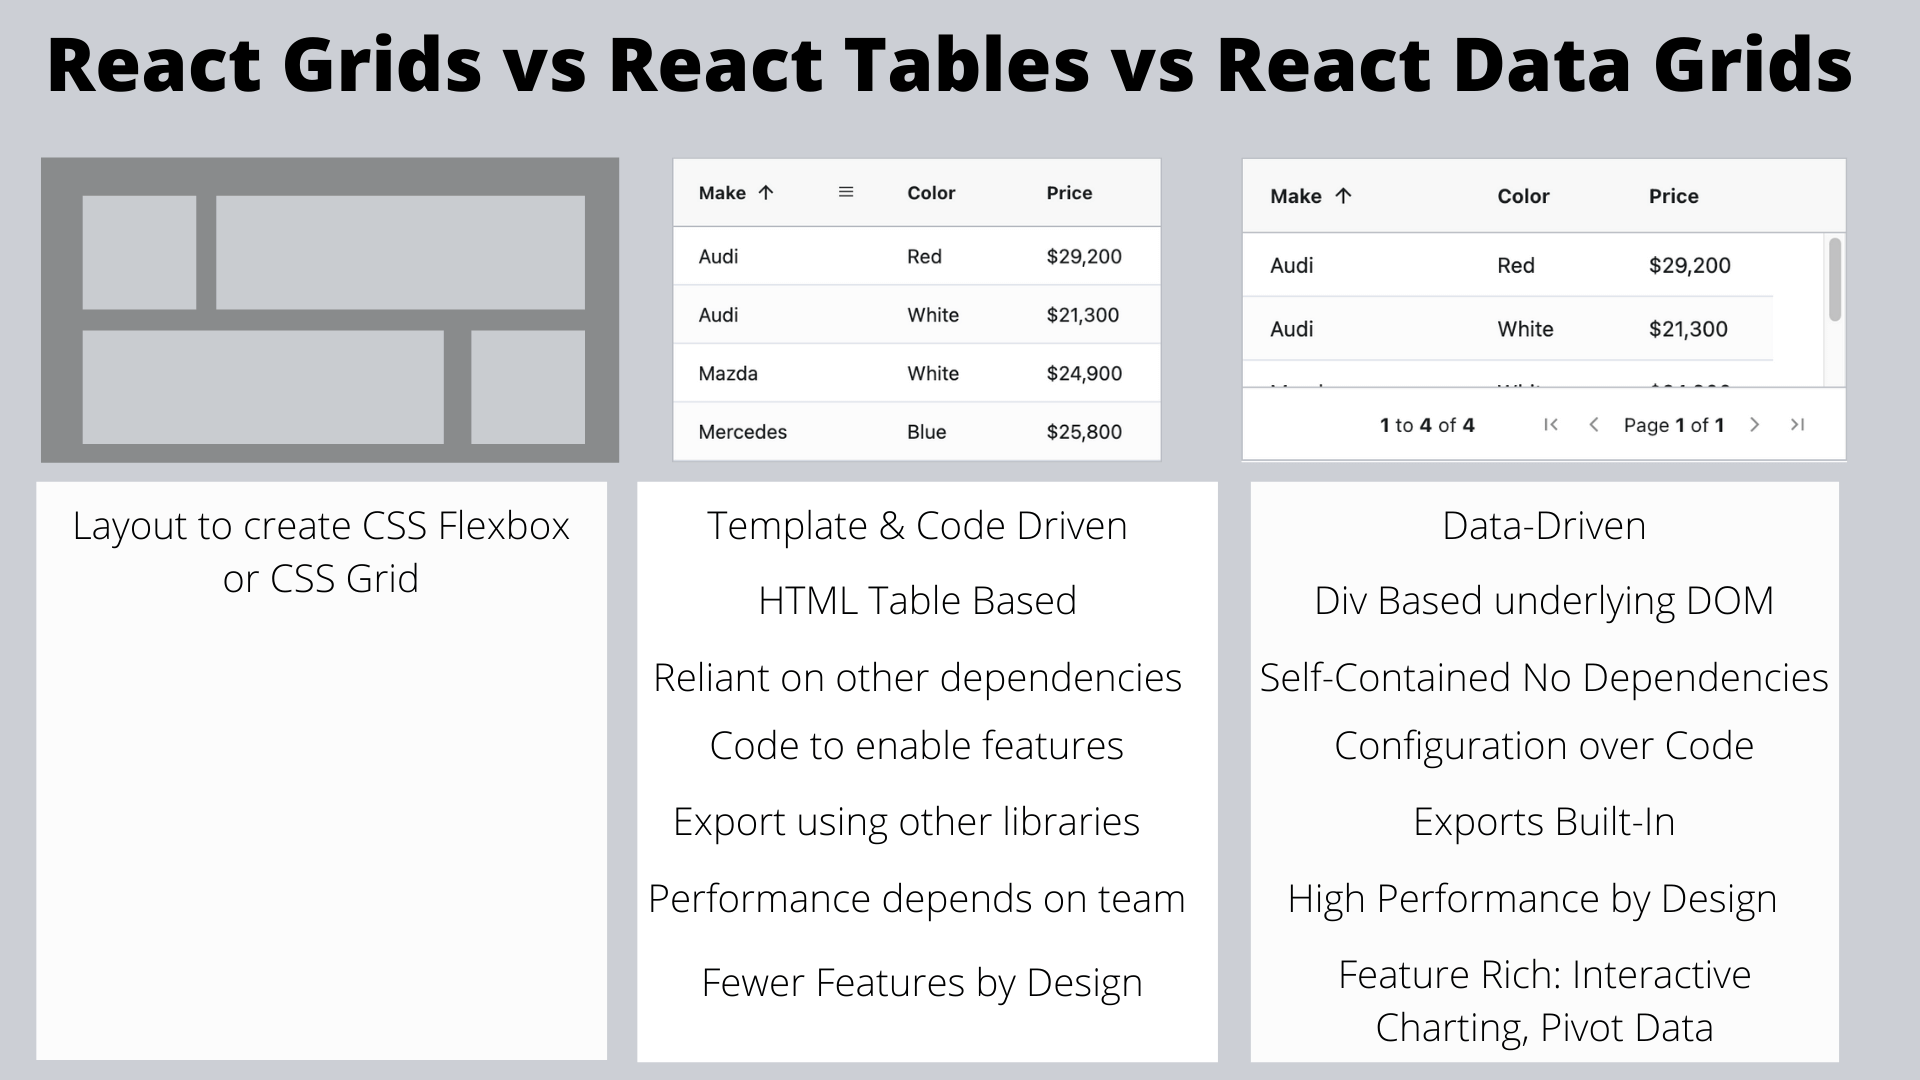
- Grid provides functionality for page layout vs.
- Data Table which provides data rendering and some interactivity vs.
- Data Grid which provides a data-driven spreadsheet-like level of interactivity.
A React Grid refers typically to a layout control to create a responsive grid layout to organise child components.
A React Table, React Data Table or React Data Grid refers to a component that can render rows and columns of data and allow the user to interact with the data, e.g. sorting and filtering data, exporting data, and in-cell editing.
AG Grid is a React Data Grid for data-driven tabular rendering. Configuration based to offer a rich user experience out of the box with minimal programming. AG Grid can be extended to cover project specific requirements and can also be used with Angular, Vue and JavaScript.
Web Terminology Overlap between Grid and Table
Web terminology has overlap with components with the words Grid and Table. There is no HTML equivalent for Data Grids where the HTML is automatically populated from a given set of data.
HTML Tables
When using HTML, we historically rendered data in rows and columns by using a table element.
<table>
   <tr><th>make</th><th>color</th><th>price</th></tr>
    <tr><td>Mercedes</td><td>Black</td><td>$25,300</td></tr>
    <tr><td>Mazda</td><td>Green</td><td>$29,200</td></tr>
</table>
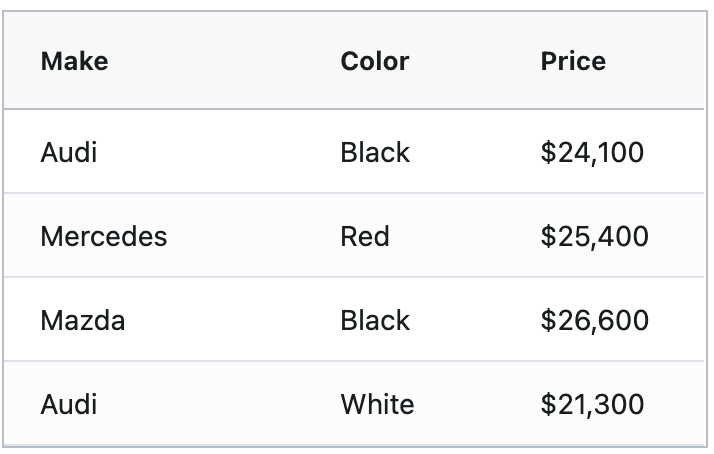
The above HTML would create a table with two rows and three columns (as shown below):
| make | color | price |
|---|---|---|
| Mercedes | Black | $25,300 |
| Mazda | Green | $29,200 |
HTML tables:
- Render all their data at the same time, so they may not be the best mechanism to display thousands of records.
- Size to fit the data. The length of the table increases as more data is displayed, they rely on the page scroll bar to navigate, so they may not be the best option for a tightly controlled screen layout.
CSS Grids
Tables were the default way to control layout on web pages, then as CSS added new functionality and float was used to push items to the left or right, or we used various positioning styles. Then Flexbox provided a one-directional layout as a row or column CSS Flexible Box Layout. Now with the CSS Grid system there is a way to layout HTML elements with a high degree of responsive control without using table elements.
CSS Grids solve a different problem than a Data Grid. CSS Grids are used to layout all the page elements, whereas Data Grids automatically render configured data in a tabular format.
The historical use of HTML tables to enforce a structure on the page layout and is a source of naming confusion. We will not look at CSS Grids or Layout grids in any additional detail in this article and instead focus on Tabular Data Rendering.
What is the difference between a Data Grid and a Data Table?
So what is the difference between a grid and a table, particularly for data grids and data tables?
-
An HTML table is a way to display data for a user but offers no way for the user to interact with the data.
-
Data Grids and Data Tables offer more interaction to the user: sorting columns, re-ordering rows, drag and drop columns, filtering, and in-cell editing.
Both Data Grid and Data Table cover similar use cases of rendering rows and columns of data; we often associate Data Tables with a requirement for less built-in functionality or a drop-in replacement for a traditional HTML table.
Data Tables build on HTML Tables
React Data Table controls often use a <table> element as their underlying DOM representation and then enhance the table to provide the user with functionality to interact with the data.
A Data Grid may look like a Table at first glance, but to support the extensive feature set available is unlikely to use a <table> as the underlying DOM representation.
Data Grids instead use nested <div> elements to allow: grouping, pivoting, in-cell editing, row editing, drag and drop of columns and rows, pinning columns and rows, etc.
Development Teams use a Data Grid when building an application where the user expects a feature rich spreadsheet-like level of interaction in the browser, and performance is a prime concern. Data Grids are used in applications where the components render in specific positions without changing size or position as data changes; the Data Grid absorbs any changes by adding scrollbars like a traditional desktop application.
A Data Table is more suitable for applications where a traditional HTML table would be used, but some additional user interaction is required.
Data Grids Often Require Fewer Dependencies
When looking at descriptions and examples for Data Grids compared to Data Tables, you may notice that Data Grids tend to be more self-contained.
When using a Data Grid, we expect to add a single component to a page, configure its size and options, and it should just work, handling scroll bars and cell sizing without any additional effort.
Data Tables often require additional dependencies to handle virtualised rows to only render visible data. They may also require additional libraries or CSS configuration to control the table height and width, and to add scroll bars, when the data in the table changes.
As an example, AG Grid requires no additional dependencies. It has been split into modules to allow importing only the required functionality. Additionally, it requires no extra dependencies for data virtualisation, scroll bars, exporting data, or charting.
The project becomes simpler to manage with one dependency because you have all the functionality and only one API to learn. Additionally, this cuts down on the risk of libraries conflicting during version updates either through bugs or interfacing API changes.
Configuration vs Coding
Data Grids support implementing standard functional requirements by configuration rather than coding or changing templates. Using a Data Grid requires less development effort to gain access to common features.
Data Grids are configured to render data by specifying fields in the data set as columns and defining which are sortable. Then when we add data to the Data Grid, the Data Grid controls how the data is rendered and manages the scrolling and loading of new data.
With a Data Table, the emphasis is on the developer to create the table configuration and build a template for the table rendering. The template code iterates over and pulls in the row and cell data or defines sort buttons in the template to enable sorting.
A Data Grid emphasises configuration above coding. While still allowing the developer to extend the grid with custom editors and renderers and hook into various events for resizing and user interaction.
To illustrate this, we can add an AG Grid React Data Grid to an application with a small amount of code:
<div className="ag-theme-alpine" style={{height: 400, width: 600}}>
   <AgGridReact rowData={rowData}>
      <AgGridColumn field="make"></AgGridColumn>
      <AgGridColumn field="color"></AgGridColumn>
      <AgGridColumn field="price"></AgGridColumn>
   </AgGridReact>
</div>
The Data Grid itself iterates over the data to render it. The grid would size itself within the parent container adding scrollbars as necessary to render the data, applying any custom styling when cells are visible.
We can enable more functionality via configuration, e.g. to support sorting, filtering, and editing.
<AgGridColumn
     field="make"
     sortable={ true }
     filter={ true }
     editable={ true }>
</AgGridColumn>
You can see an example of AG Grid configuration in the React Data Grid Getting Started Guide
The Data Grid would respond to changes in the underlying data set and re-render only the portions displayed to the user and requires no extra programming effort to create a high performant Data Grid.
Data Grids as a Table Replacement
A Data Grid can visually take the place of a standard HTML table if we want to render data in a tabular format. Doing so will not take full advantage of the functionality of a grid, but it is possible.
Using AG Grid as an example, we can simulate a "Table" with a single configuration statement.
domLayout='print'
The above example configuration enables AG Grid's Print Preview mode, which will render the entire grid as a table like control without any scroll bars. The table will be the height of all the displayed data rows. We use this for rendering grid data as a report, and this mode supports features like avoiding row splitting across pages when printed.
AG Grid could act as an interactive table replacement, but we only recommend that use-case for printing. Data Grids are best employed when the user requires a rich interactive experience, similar to a spreadsheet experience.
Customising Data Grids and Data Tables
HTML tables are styled through CSS.
When working with a Data Grid or Table component, you can style the grid using CSS or by creating a CSS theme.
You can also customise the feature set with custom components..
Custom Cell Renderers and Editors
For additional customisation Data Grids and some Data Tables allow the use of custom cell renderers and editors.
For specific domain or application needs, homegrown or off-the-shelf components could be used in place of the built-in Data Grid cell renderers or editors.
For example, we might add a custom date control to edit dates in a cell or render ratings as a row of star icons.
What Features Do Data Grids And Data Tables Have In Common?
Part of the confusion between Data Grids and Data Tables is the functionality that they have in common.
Both render data in a tabular form, and both tend to support sorting, in-cell editing, pagination, row and cell selection, formatting cells, drag and drop ordering.
One difference between these features is that they are often single-line configuration changes in a Data Grid. With Data Tables, there are often changes required to the rendering template and the addition of code to handle change events. Data Grids handle this themselves and expose hooks to allow additional domain-specific functionality.
What Data Grid Features Does a Data Table Tend to Lack?
We view AG Grid as a Data Grid and have built features we would not expect to see in a Data Table. However, different companies and projects often use the terms Data Table and Data Grid interchangeably.
Data Grids tend to be Data-Driven and are designed to handle enterprise high-Performance scenarios. Data Grids are often used for financial trading apps where real-time updates happen hundreds of thousand times per second. The grid is configured for a certain size and to render specific fields. The grid automatically applies filters and renders the data, adapting as more data is added and removed from the grid, updating only the visibly changed data. Scrolling through large data sets happens smoothly and without requiring any additional dependencies.
Data Grids tend to be built with user interaction in mind from the start, so a rich user experience tends to involve less developer effort. While both may support filtering, the filtering is usually built into a Data Grid and enabled with a single configuration line.
The focus on user interaction means that Data Grids often support more selection options than a Data Table. A Data Table may allow row selection for copy and pasting data. Data Grids often allow discontiguous row and cell selection and range selection to feed into more advanced functionality.
<AgGridReact enableRangeSelection={true}>
   {/* column definitions ... */}
</AgGridReact>
For a specific example, consider AG Grid; the user can select data in the grid and create charts to visualise the data. The charts update as the underlying data changes. This dynamic charting requires no programming time to implement; the interaction complexity is handled by the grid itself and can be enabled with a single additional configuration property:
<AgGridReact enableRangeSelection={true} enableCharts={true}>
   {/* column definitions ... */}
</AgGridReact\>
Data Grids are designed from the outset to support external sources either from API calls or queries sent to the server. They work with massive data sets that are too large to load all the data into a browser at once.
Data Grids provide rich exporting options. Many tables require extra libraries to support exporting. Data Grids usually provide export options with no additional library dependencies. For example, AG Grid supports CSV and extensive Excel exporting out of the box.
Many Data Tables support Data Grouping and Aggregation.
Data Grids often go further and allow user customisable Pivoting, in much the same way that a spreadsheet allows data pivots for exploratory data analysis and business intelligence. Data values in cells and any related graphs would update automatically as the underlying data updates in real-time.
You can watch an overview of interactive charting:
Should you write your own Data Grid?
Data Tables are often presented as an introductory coding example to illustrate adding extra features to an HTML page, which can lead to the impression that creating a homegrown Data Table or Data Grid component is simple and worth the time and effort. A previous blog post describes some experiences of writing a custom Data Table.
If your functional requirements are minimal
If you don't want to do much and can isolate the code to a few pages, for example: sorting HTML table rows when clicking on a column header, then it might not take much effort to implement. But if you want to represent data in tabular format and have a rich level of user interaction, then the effort involved in coding a component is unlikely to be worth the effort.
Focus on your business goals
Even the most basic open-source Data Table libraries support sorting tables, and the code will have been tested and used in multiple applications. You would be better expending your development effort on the unique domain requirements for your specific application and use 3rd party components for functionality that, while fun to write, is not core to your business goal.
Consider Support
When you build a component yourself, you have to support it, taking development time away from your core business.
When adopting a free open source component, the support is likely to be provided over Github or StackOverflow and managed by the community. AG Grid's community edition has free support using this model.
Some open-source components have the option to pay extra for more dedicated support.
When using a commercial component, you should expect access to a team of support professionals with a professional help desk. AG Grid has a dedicated team of JavaScript developers working to support customers. Customers have access to an extensive knowledge base of sample code. Our support team actively works with customers, building example code to help with specific use-cases during implementation. AG Grid Support is included with an up to date license subscription.
Build or Buy?
So... build your own if the aim of your business is to sell custom components, otherwise, adopt an existing component and add value to your users faster.
Data Grid or Data Table?
The choice is, do you look for a Data Table, or do you look for a Data Grid?
Evaluate Data Tables if you are thinking of something smaller, handling most of the data in the browser and if your original use case is an HTML table rendering the data.
Evaluate a Data Grid if you are building an application where your users demand performance and a rich feature set. Configuration over coding allows you to add a lot of value quickly. You will be able to add custom code to augment the Data Grid for specific business requirements.
Spreadsheet like interactivity vs. Rendering Data vs. Layout
Because of the overlap in terminology, some components call themselves Data Tables and offer some of the functionality associated with a Data Grid.
As a general rule, expect Data Tables to have a reduced feature set compared to a Data Grid. This is by design, if the original usecase called for a simple table then a smaller library to add sorting to the table can boost usability without adding much complexity to the project.
Additionally, expect to add more libraries and extra coding to obtain the functionality offered by a Data Grid out of the box e.g. row virtualisation for performance is not a core function for HTML tables and is unlikely to be included in Table libraries.
We are aware that some projects require a smaller feature set from components to meet the requirements, and there are a lot of Data Tables and Data Grids on the Market. This article is intended to help clarify the differences between a Grid, Data Table and Data Grid:
- Grid
- Helps with page layout.
- Data Table
- Render data in an HTML table.
- Support for coding user interaction features.
- Enabling features requires template changes and event handling code.
- Some features require additional libraries and programmer effort, e.g., row virtualisation for performance, scrollbars for usability.
- Template Driven, the template controls the rendering.
- Data Grid
- Renders data in tabular form with the underlying DOM designed for performance.
- Enable user interaction with configuration.
- Configuration over coding for standard use-cases.
- Feature-rich out of the box without adding dependencies.
- Data-Driven, once configured, add data and let the Data Grid do the work.
Both Data Tables and Data Grids offer teams the ability to customise with additional features and work with external libraries. With a Data Grid, you should require fewer external libraries and dependencies because the Data Grid is designed to do more heavy lifting out of the box.
AG Grid is a Data Grid
Obviously we are biased and would like you to evaluate AG Grid and you can start with our free data grid community edition.
AG Grid is a Data Grid. We have designed it to help teams create rich user interfaces very quickly with many features supported out of the box via configuration. It is highly performant and used for real-time financial trading in organisations world wide.
The free community edition covers most of the use-cases from a Data Grid: sorting, filtering, in-line editing, custom renderers, custom editors, styles, drag and drop column and row ordering, api data loading with fast performance using large data sets.
Some functionality like Excel export, Server Side Row for massive data sets, and Integrated Charting is exclusively available in the Enterprise edition. The complete list of features for AG Grid is described in our documentation, including a feature comparison between community and enterprise editions.
Learn more about AG Grid React Data Grid: