This post contributed to the AG Grid blog by Cameron Pavey.
React describes itself as a “JavaScript library for building user interfaces.” Its internal workings are quite complex, but there are essentially two main pieces: React itself and the React renderer, which is react-dom in the case of web browsers.
The main React library is responsible for taking your code and converting it to a structure that a React renderer, such as react-dom, can then use to reconcile the desired state with the current state, and make the necessary changes for those two states to converge. How you write your code can have a great impact on the magnitude of these changes. It’s not uncommon for React to make more changes than strictly necessary when reconciling the Document Object Model (DOM). These changes, or “renders,” can typically be reduced by optimizing your code in various ways. Such optimizations are generally desirable, but even more so when dealing with large volumes of data or many DOM nodes. While unoptimized code may not be problematic in small quantities, at scale, it can quickly affect user experience.
In this guide, you’ll learn about some of these optimizations. You’ll also learn about some common mistakes that can lead to unnecessary renders, and you’ll see how you can avoid them.
AG Grid, a high-performance Data Grid, plays a large role in this guide. It works well with most leading frontend libraries, including React, and provides a good use case for the optimizations discussed here for two reasons. Firstly, AG Grid itself is optimized internally, and thus the impact of poorly optimized code surrounding it is more apparent. Secondly, AG Grid is capable of dealing with tremendous amounts of data, which can often have an adverse impact on performance if mishandled, but is also an excellent way to test the efficacy of supposed code optimizations at scale.
Profiling the Unoptimized Grid
In order to focus on the optimizations themselves, this guide won’t cover the building of the unoptimized application step by step. Instead, if you’d like to follow along, you can clone the unoptimized source code for this guide from the public GitHub repo.
You also need the following prerequisites:
- a recent version of Node.js and npm
- a code editor (VS Code is a good choice if you don’t have an existing preference.)
As mentioned before, AG Grid is already quite heavily optimized, so much so that any adverse performance issues you may encounter while using it are likely to be in your application code, and the code surrounding your usage of the Grid component. To this end, the optimizations covered in this article will primarily focus on this surrounding code to help ensure that you’re using AG Grid as responsibly as possible.
To establish a baseline for these optimizations, you need to see how the current unoptimized application performs. There are a few different ways to do this. The most common way is to use the React Developer Tools browser extension, which includes a purpose-built profiler. This profiler lets you see details about your application, like which components were re-rendered in a given commit, why they were re-rendered, and how long it took to do so. If you want to follow along with this tutorial, go ahead and add this extension to your browser.
Once you’ve cloned the demo application from the public GitHub repo, navigate into the newly created directory, and run the following commands:
npm install
npm run start
This command installs the code dependencies and starts the development server. Once started, the development server will indicate which port it’s running on (typically port 3000) and open the demo application in your default browser.
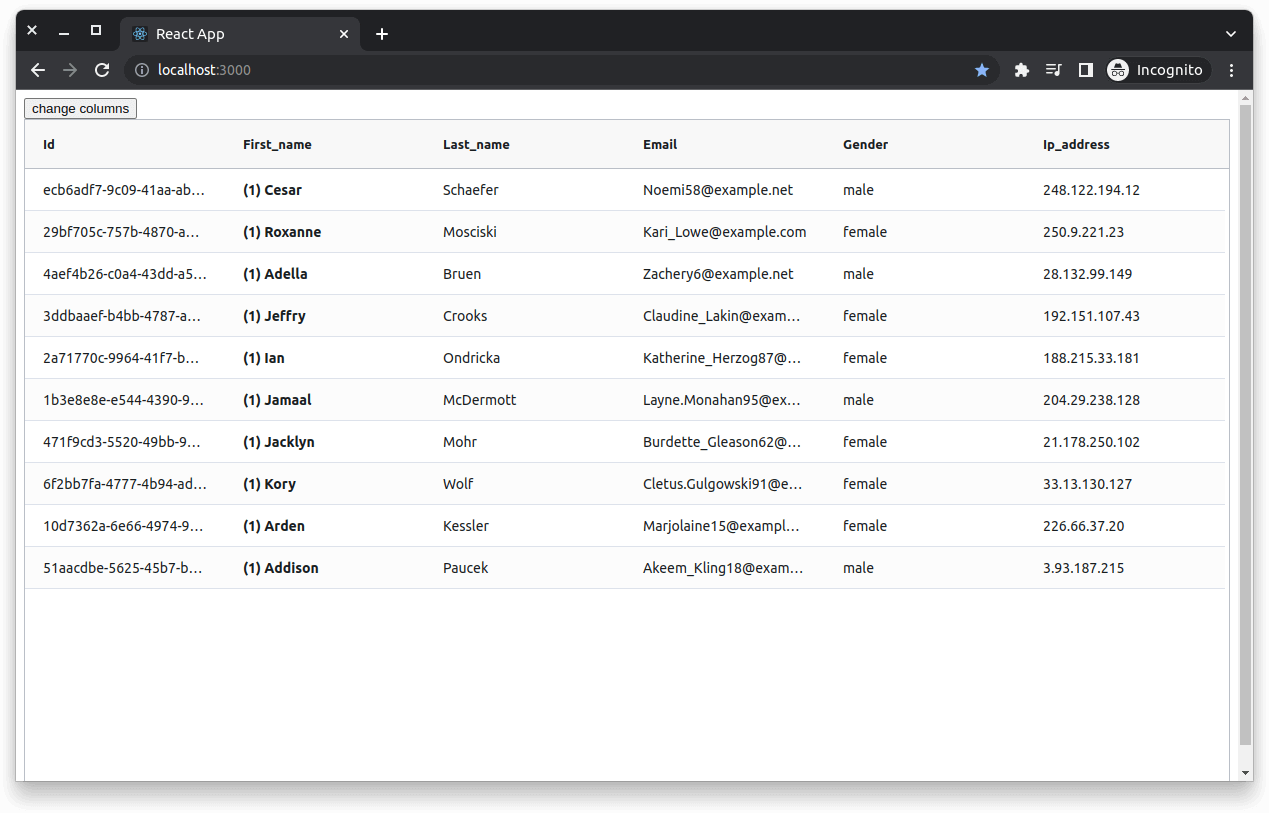
When the page has loaded, you should see something like this:
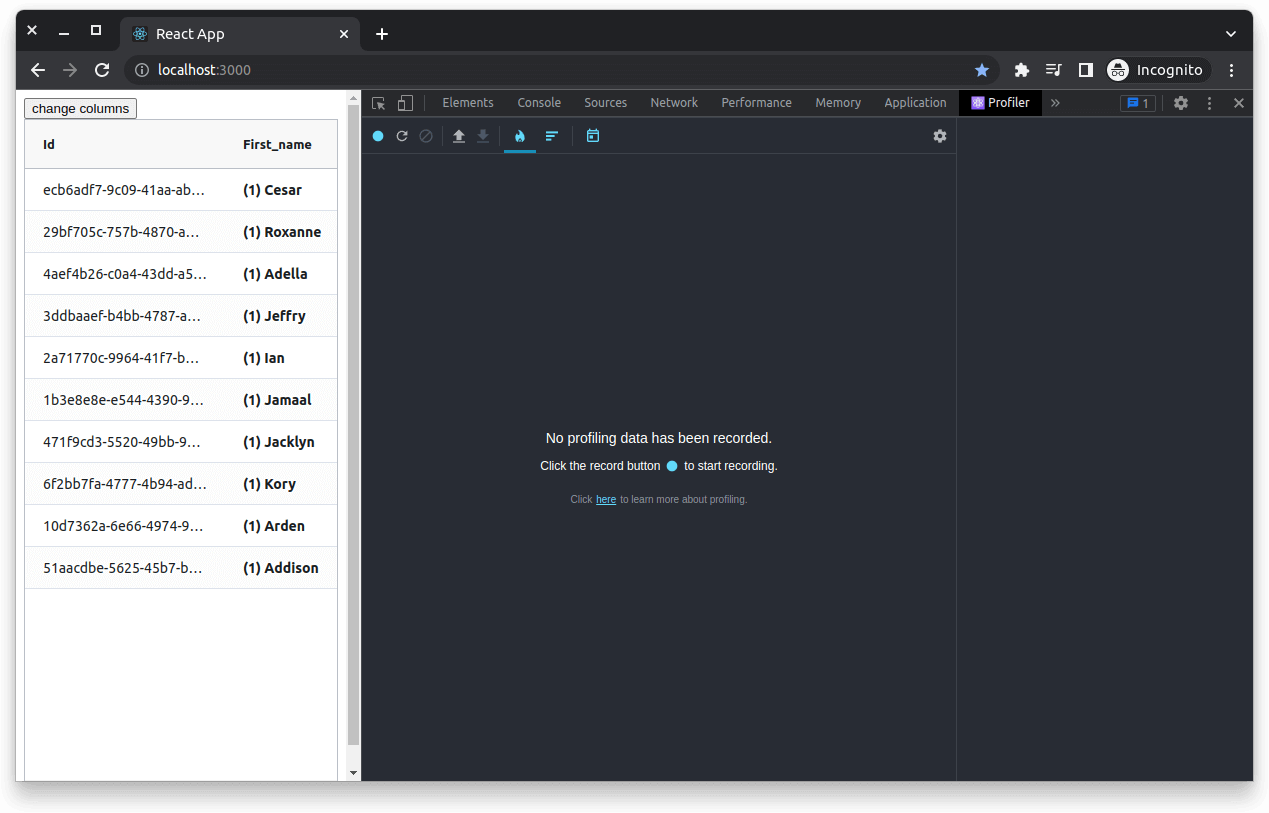
Open the developer tools by right-clicking somewhere on the page and selecting Inspect. By default, this will open the Elements tab. You can find the React DevTools Profiler by selecting the Profiler tab. You may need to click the arrow icon at the end of the tabs to see it:
The DevTools are quite extensive, and their full functionality is beyond the scope of this guide. If you want to learn more about the DevTools as a whole, you can start with this guide that focuses primarily on the profiling functionality.
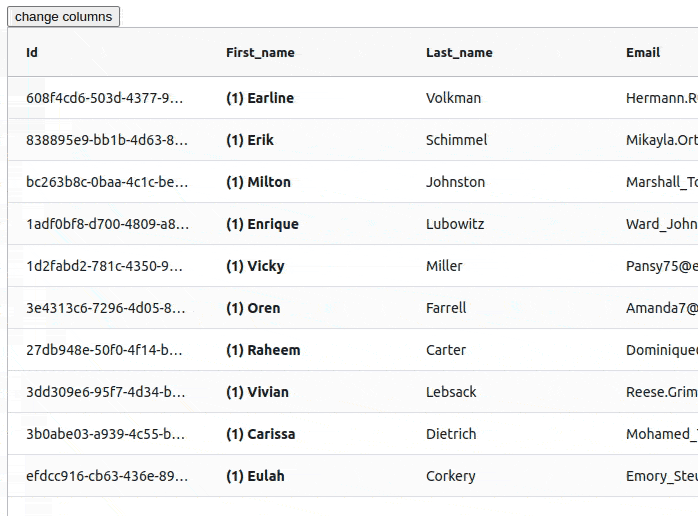
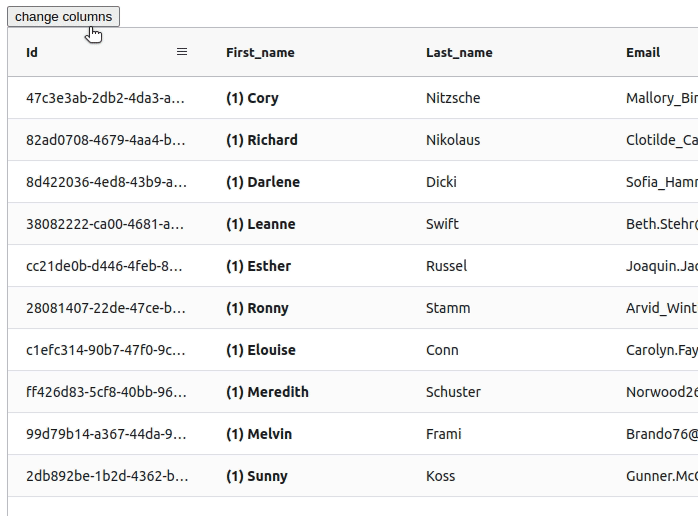
The unoptimized Grid has a few issues that cause unnecessary re-renders. To help identify these, some visual aids have been added, but it’s also possible to see them in the profiler. To get a consistent baseline for later measurements, it helps to do some controlled checks that you can replicate later. In this initial measurement, perform the following actions:
- Start the profiler recording
- For each of the first four cells in the First_name column, click on the cell once
- Next, click the Change Columns button four times
- Stop the profiler recording
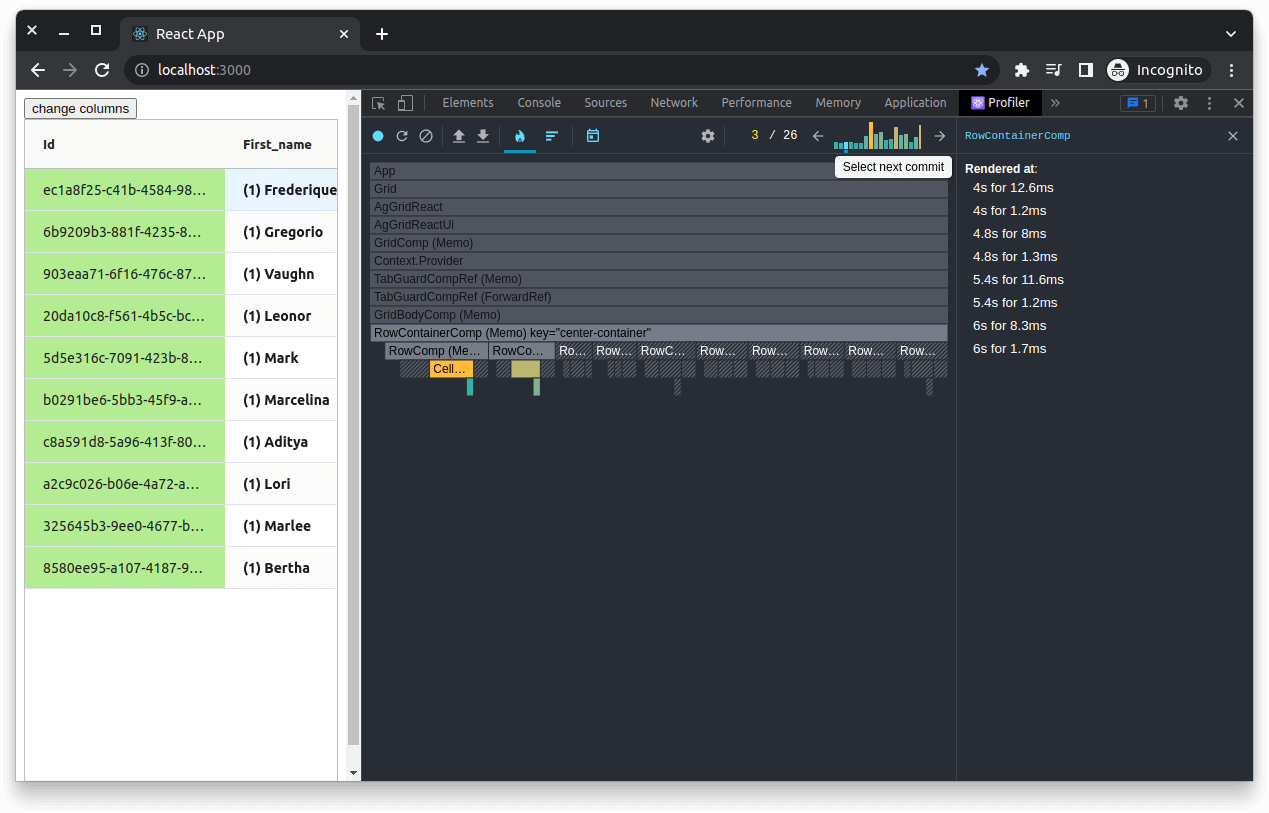
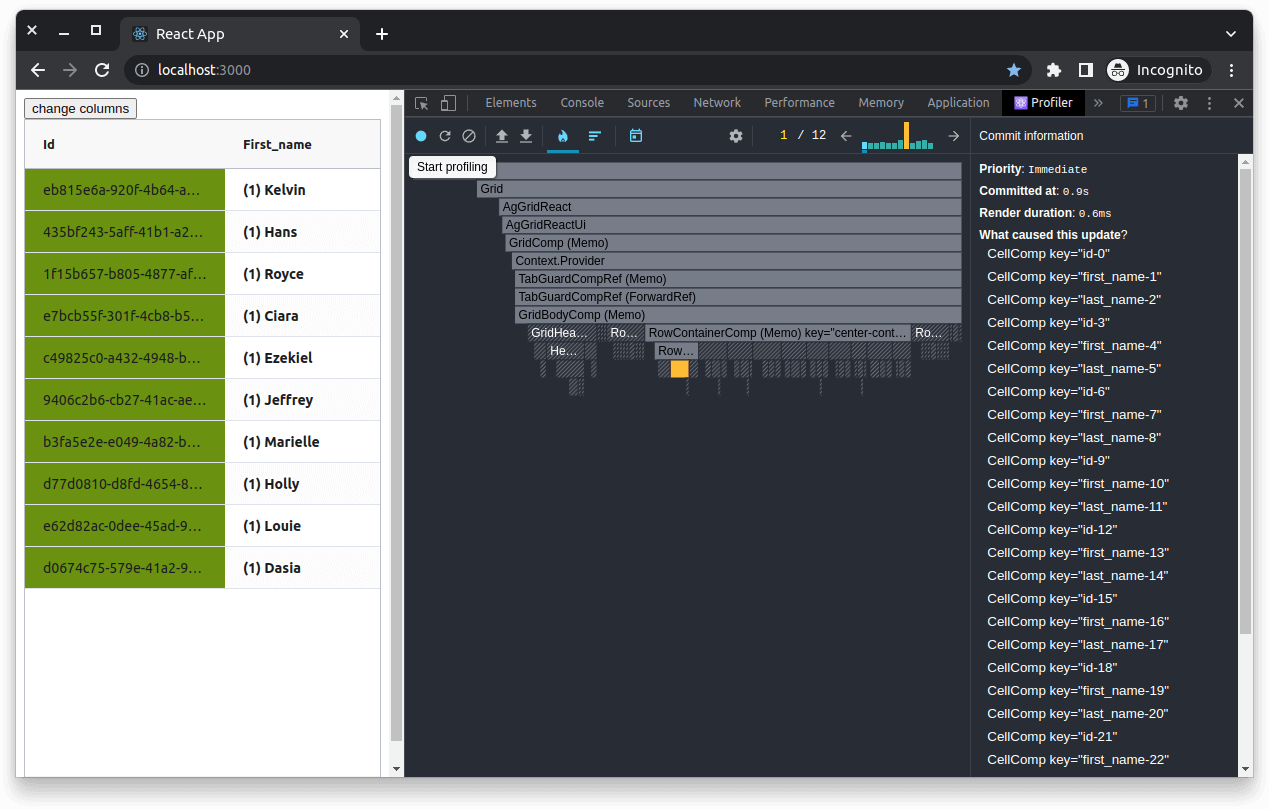
As you interact with the table, you’ll notice that some visual aspects changed like the color of the Id column and the numbers prefixing the First_name values. These are visual helpers added to show when certain components have re-rendered. Before you learn about this in more detail, let’s take a look at the results in the profiler:
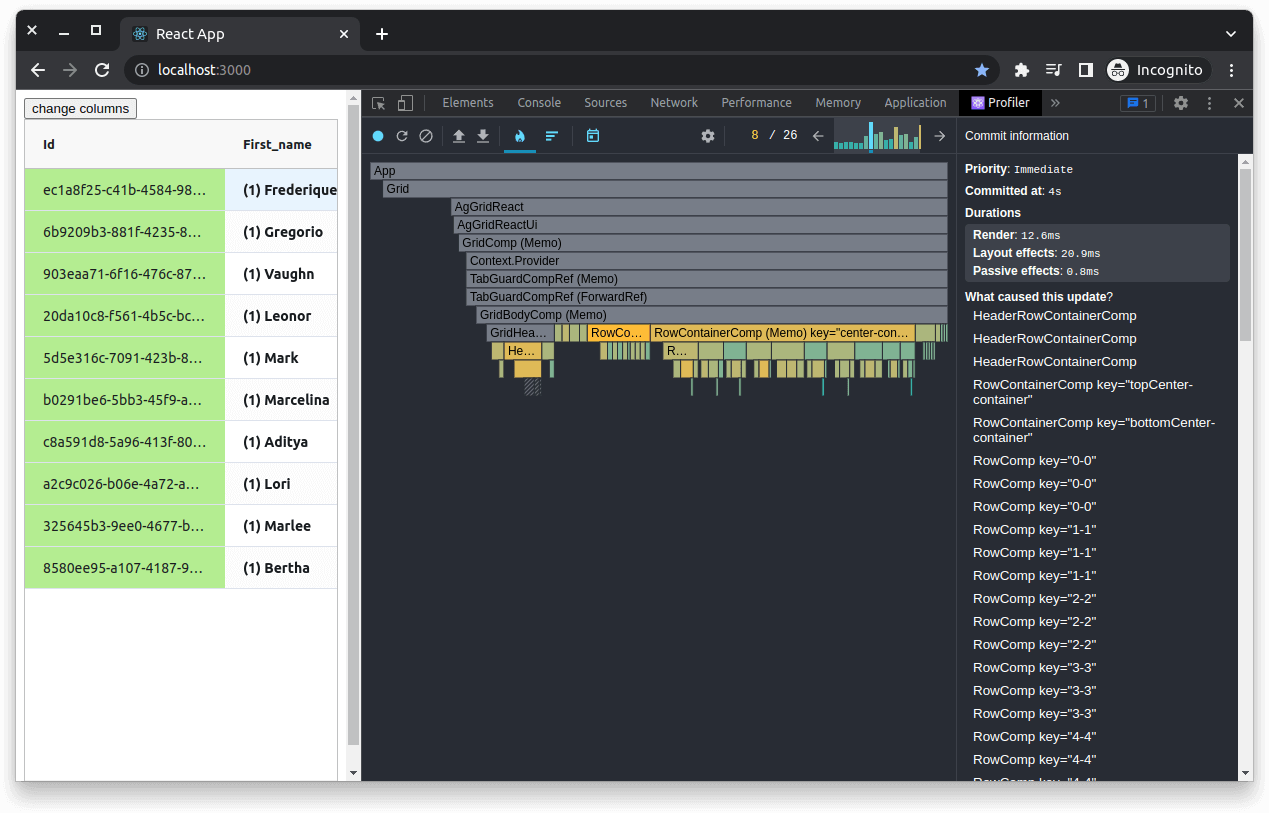
Your exact output may vary if you didn’t follow the actions outlined above precisely. Near the top of the profiler, there is a small chart that you can cycle through, along with some numbers:
This chart represents the commits made by React and their relative durations. The larger the bar, the longer the commit took. In this scenario, the commits don’t take very long (the largest one only takes about 12 ms). However, the principles here apply equally to larger React applications that may be affected by more adverse performance issues, with renders that take anywhere from 100 ms to full seconds.
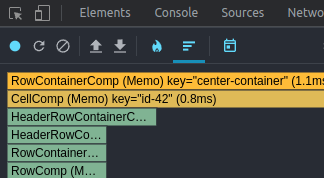
As you cycle through the commits, different parts of the flame graph will be highlighted, representing the re-rendered components in a given commit. Looking at the previous screenshot, you can see that in the highlighted commit (and the other similar spikes in the graph), all of the rows re-rendered. This results in the slowest commits out of those that the profiler captured. If you go back and look at the first few commits, you can similarly see that each time you clicked on one of the cells, it caused two cells to be re-rendered—the one that you clicked on and the one that you were already focused on:
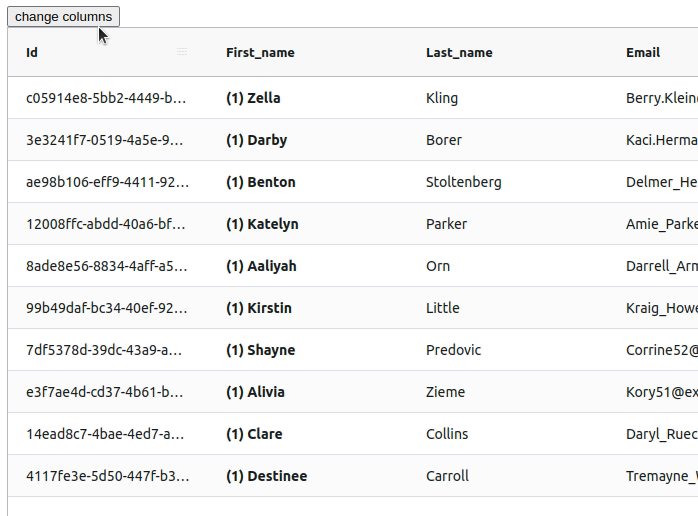
This can cause inefficiencies if those cells are using expensive, poorly optimized custom cell renderers. The First_name column uses a custom cell renderer to display the counter in parenthesis. This counter will increment by one, each time the component is re-rendered. This is a fairly inexpensive operation, but you can see how often it’s triggered by clicking around on these cells. If this were a more expensive operation, it could have a significant impact. Similarly, each time you click the Change Columns button, the columnDefs prop on the AG Grid component is updated with a similar (though not identical) value. As a side effect of this, the object that defines the column’s coloring gets recreated each time this happens with a random color:
Optimizing the Grid
In the next section, you’ll learn a few techniques that you can use to optimize your application and reduce some of the unnecessary re-renders. After the optimizations, you can run the profiler again while performing the same actions listed above. This will give you clear data showing what impact the optimizations had. Before proceeding, you may want to download the data in this profile for future comparison. You can do this by clicking the down arrow icon in the top left corner:
Memoized Components
If you haven’t already done so, open the cloned codebase in your editor of choice. The first optimization to look at relates to the custom cell renderers. The counter included in this component increments each time it is re-rendered, but essentially all of these re-renders are wasted because the cell’s content doesn’t change. You can alleviate this issue with the React.memo Higher-Order Component (HOC) that wraps your components and essentially returns the previously computed value if none of the inputs changed.
Begin by opening the file located at src/components/name-formatter.jsx, which is currently just a normal Function Component. To stop it from needlessly re-computing its output, all you need to do is wrap it in the HOC like this:
import * as React from 'react';

const NameFormatter = React.memo(({ value }) => {
  const renderCountRef = React.useRef(1);
  return (
	<strong>
  	{`(${renderCountRef.current++}) ${value}`}
	</strong>
  );
});

export default NameFormatter;
Please note: It’s inadvisable to simply wrap all of your components with this HOC. There is a time and a place for it, but generally, if you have a component that renders often and renders deterministically, that is, for a given set of input props, it will always give the same output. Wrapping it with
React.memocan help you eliminate some excess renders.
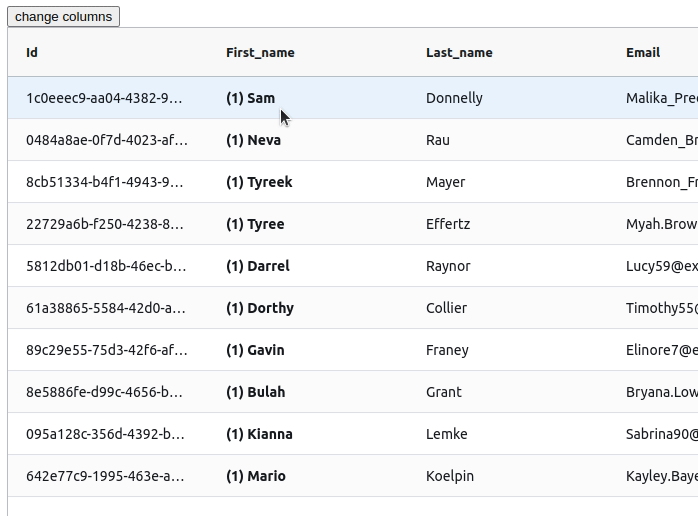
After the application has reloaded, save your changes, and then click on the First_name cells. You should find that doing so no longer causes the counters to increment. React simply uses the previously returned value rather than rendering a newly computed value because the input props don’t change:
Caching Expensive Values
You may have noticed that when you interact with the unoptimized Grid and click the Change Columns button, the rows in the table change. This data is randomly generated with a library called @faker-js/faker. In real life, this data would likely be coming from an API endpoint. For simplicity, this data generator is being used in favor of a real API. However, the principle behind this optimization remains the same.
In this instance, the value produced by the fake data generator is not being preserved when the Grid component re-renders. Each time input props change, all of the data is regenerated. If this was an API call, it would likely be making network requests each time the props change instead. This behavior is not optimal because of its impact on performance and, in most cases, it wastes resources. Typically, it would be better to cache this value and reuse it between renders. There are some cases where you might want to regenerate or re-fetch the data, but this should be done deliberately and not as a side effect of poorly optimized code.
There are a few different React hooks that you can use to cache your data, depending on the scenario. For reference, the current unoptimized implementation in src/components/grid.jsx has the data generator function being called without any hooks, so it will be called on each render:
// Unoptimized
function Grid({ columnDefs, defaultColDef }) {
  // This will be called on each render
  const data = getData(10);

  return (
	<div className="ag-theme-alpine" style={{ height: '98vh' }}>
  	<AgGridReact
    	maintainColumnOrder
    	defaultColDef={defaultColDef}
    	rowData={data}
    	columnDefs={columnDefs}
  	/>
	</div>
  );
}
If your data is coming from a synchronous function, as is the case here, you can wrap the value with the React.useMemo hook. This behaves similarly to the aforementioned React.memo, but rather than being a HOC, it’s a hook that you can apply to values other than just components and its approach looks like this:
function Grid({ columnDefs, defaultColDef }) {
  // This value will now persist between renders
  const data = React.useMemo(() => getData(10), []);

  return (
	<div className="ag-theme-alpine" style={{ height: '98vh' }}>
  	<AgGridReact
    	maintainColumnOrder
    	defaultColDef={defaultColDef}
    	rowData={data}
    	columnDefs={columnDefs}
  	/>
	</div>
  );
}
This approach works well for functions like getData here, but does not work so well for asynchronous operations like API calls. In such cases, you can instead use a combination of React.useState and React.useEffect to asynchronously call the API, and set the value into a state hook when it resolves. That approach looks like this:
function Grid({ columnDefs, defaultColDef }) {
  const [data, setData] = React.useState([]);

  // This effect will be invoked the first time the component renders
  React.useEffect(() => {
	(async () => {
        	// This value will be persisted between renders
  	setData(getData(10));
	})();
  }, []);

  return (
	<div className="ag-theme-alpine" style={{ height: '98vh' }}>
  	<AgGridReact
    	maintainColumnOrder
    	defaultColDef={defaultColDef}
    	rowData={data}
    	columnDefs={columnDefs}
  	/>
	</div>
  );
}
Note that while
getDatais not an asynchronous function, this pattern works here and can be used with asynchronous API calls. Deciding which pattern is best for you will depend on the specifics of your application; however, betweenReact.useState,React.useEffect, andReact.useMemo, you should be able to derive a solution for most scenarios. It’s a good idea to familiarize yourself with React Hooks if you have not already done so, as they have some rather nuanced behavior but are generally quite powerful.
After applying either of these optimizations (the useMemo approach or the useEffect approach), you will discover that the rows themselves no longer change when you click Change Columns. The data is now persisted between renders:
The next optimization addresses the random colors being assigned to the Id column.
Extracting Static Values
If you look at src/app.jsx, you’ll see the following block of code:
  const updateColumns = () => {
	setColumnDefs([
  	{ field: 'id', cellStyle: { background: randomColor() } },
  	{ field: 'first_name', cellRenderer: NameFormatter },
  	{ field: 'last_name' },
  	{ field: 'email' },
  	{ field: 'gender' },
  	{ field: 'ip_address' },
	]);
  };
The first object in this array has a property called cellStyle. This property contains a CSS style object that will be applied to all of the cells in this column. In this instance, the value of this property is dynamically computed each time the updateColumns function is called, which is why the column color changes each time you click the Change Columns button. This is a contrived example to demonstrate that passing objects by value like this results in a new instance of the object being created each time and is not desirable behavior. Even if the column definitions were to change, it’s unnecessary to recompute all of the values for all of their properties. You can eliminate the color-changing behavior of the column by making the following optimizations:
// 1. Extract the value of the cellStyle property to outside of the App component
const cellStyle = { background: randomColor() };

function App() {
…
// 2. Update the updateColumns function to use this extracted value
  const updateColumns = () => {
	setColumnDefs([
  	{ field: 'id', cellStyle },
  	{ field: 'first_name', cellRenderer: NameFormatter },
  	{ field: 'last_name' },
  	{ field: 'email' },
  	{ field: 'gender' },
  	{ field: 'ip_address' },
	]);
  };
Now, whenever updateColumns is called, although the columnDefs prop will still change, the style object applied to the Id column will remain consistent, thus eliminating the random color changes. It should be noted that it will still change color after the first time you click the Change Columns button, as the initial value supplied to the useState hook does not have a cellStyle supplied for that column.
Profiling the Optimized Grid
With these optimizations applied, you can see that AG Grid’s behavior is perceptibly less erratic. Now it’s time to profile the application again to see if these optimizations have a measurable impact. To do this, run through the same actions taken during the first measurements, listed here again for your convenience:
- Start the profiler recording
- For each of the first four cells in the First_name column, click on the cell once
- Next, click the Change Columns button four times
- Stop the profiler recording
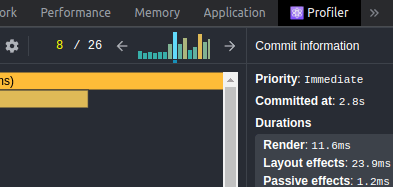
After stopping the profiler, you should see something like this:
You will note that the number of commits is down to twelve (from the original twenty-six), and there is only one large spike this time (instead of four), which corresponds with the one time the cellStyle changes. The optimizations have had a respectable impact on the render performance of this application.
Understanding how and why these optimizations work puts you in a position to apply them at your discretion. Not every application will be as simple as this contrived example, but the patterns used here are generally applicable in many real-world scenarios.
Increasing the Amount of Data
In a real application, you will likely be dealing with much larger volumes of data than the ten rows in this demo application. To ensure these optimizations hold up under load, you can easily tweak the random data generator call found in src/components/grid.jsx to generate 100,000 rows of data or more. To do this, tweak the useEffect block this way:
  React.useEffect(() => {
	(async () => {
  	setData(getData(100000));
	})();
  }, []);
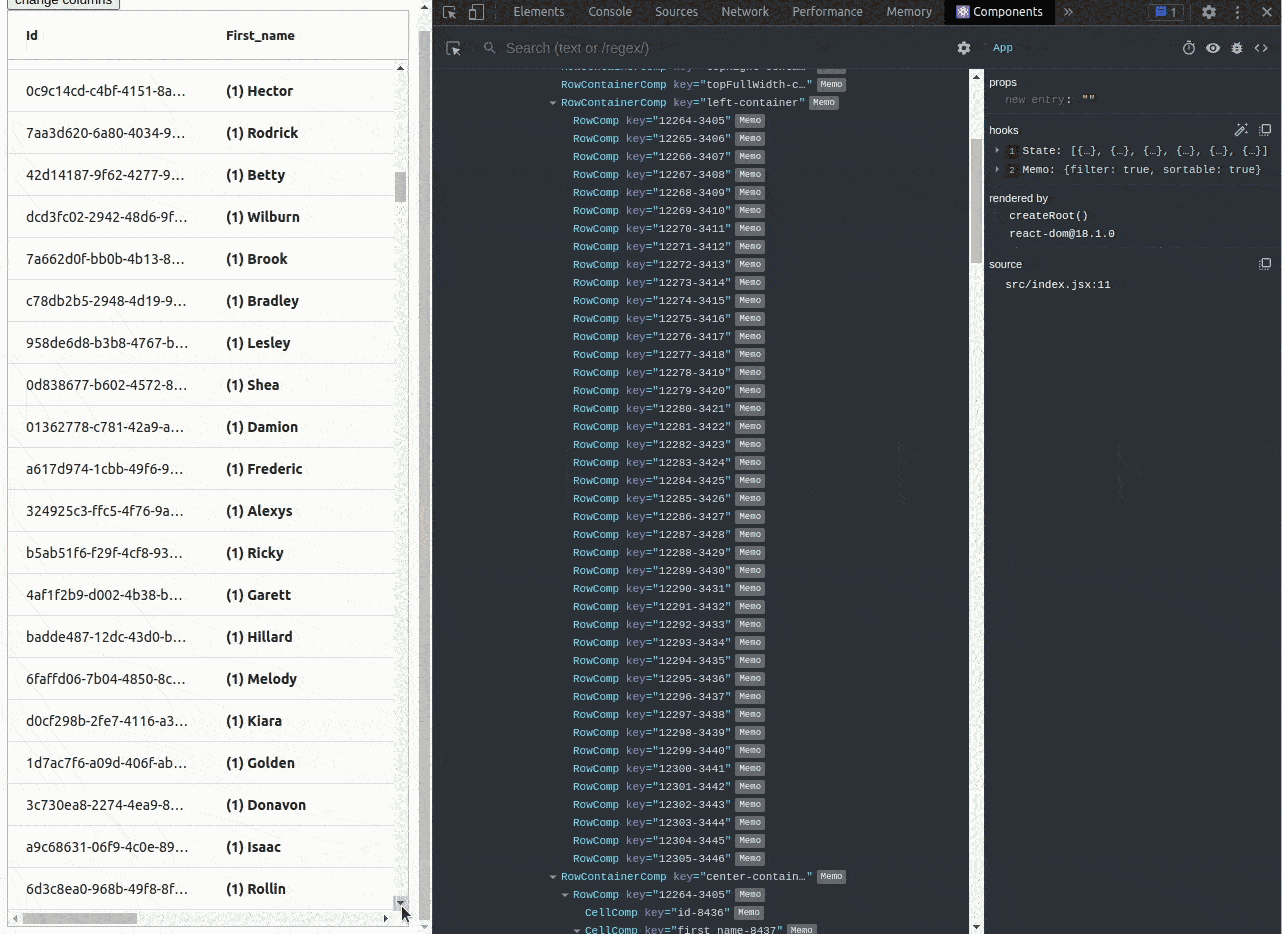
Now, if you save and reload the page, you should see a lot more data. You can run the profiler and step through the actions again, but you will likely find that there isn’t any perceptible performance difference. This is largely thanks to optimizations built into AG Grid, including virtualization.
A source of performance issues for many browsers is the DOM. When the DOM has too many nodes (such as 100,000 table rows), it’s easy for performance to suffer if these nodes exhibit any kind of complexity beyond being simple text containers. One of the most common ways to solve this is through DOM Virtualization, where only the visible elements are rendered. As the user scrolls, React will render new elements as they come into view, and old elements will be removed once they are no longer visible. You can see this in practice using React DevTools.
Aside from the profiler, there is also a Components tab that you can access. This tab will show you all of the React components rendered on the page and details about them. If you navigate to this view and scroll down the Grid, you will notice that the number of row components doesn’t increase or decrease much (there is slight fluctuation when rows are half visible), but the rows themselves change. This is virtualization in action:
Conclusion
In this article, you’ve seen how poorly optimized code can have a detrimental impact on the render performance of your application. You have also learned how to leverage React Hooks to apply optimizations to reduce this impact. It’s important to be aware of optimizations like these to avoid making such mistakes in your applications. Those mistakes can lead to unnecessary re-renders even when using highly optimized libraries like AG Grid.
Aside from DOM virtualization, AG Grid applies numerous optimizations internally to ensure that there are no wasted renders from the library itself. Keenly optimized performance is just one of the benefits. AG Grid also has numerous powerful features, from handling massive amounts of data to livestreaming data updates and integrated charting. If you’re looking for a robust all-in-one Data Grid solution, and performance is a must, give AG Grid a try.
All the code samples in this article can be found in this GitHub repo.