

In this blogpost, we will showcase the lightning performance from ag-grid with Material UI components, React and Redux. We will illustrate this with a live example simulating a simple trading platform. This sample demonstrates a number of best practices with ag-Grid and React - passing properties to React Renderers, reading Redux state from a renderer, editing in React, among others.
Please see the live example below and check out the code:
You can get the code to run the application locally from this Github repo:
https://github.com/icedjello/redux-blog-trade-spoof
Contents
- Lightning Performance Using React Renderers
- Passing properties to React Renderers
- Reading redux state from a renderer
- Editing in React
- Miscellaneous Grid Features
Lightning Performance Using React Renderers
Documentation: Updating Data
Ag-Grid provides delta updates and batch transactions to allow for state of the art performant updates of large amounts of data. Note, that in this example we are using delta updates (also called immutableData in later versions of ag-Grid).
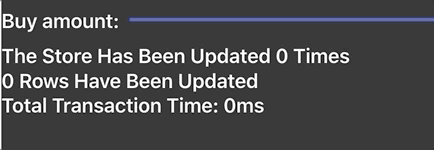
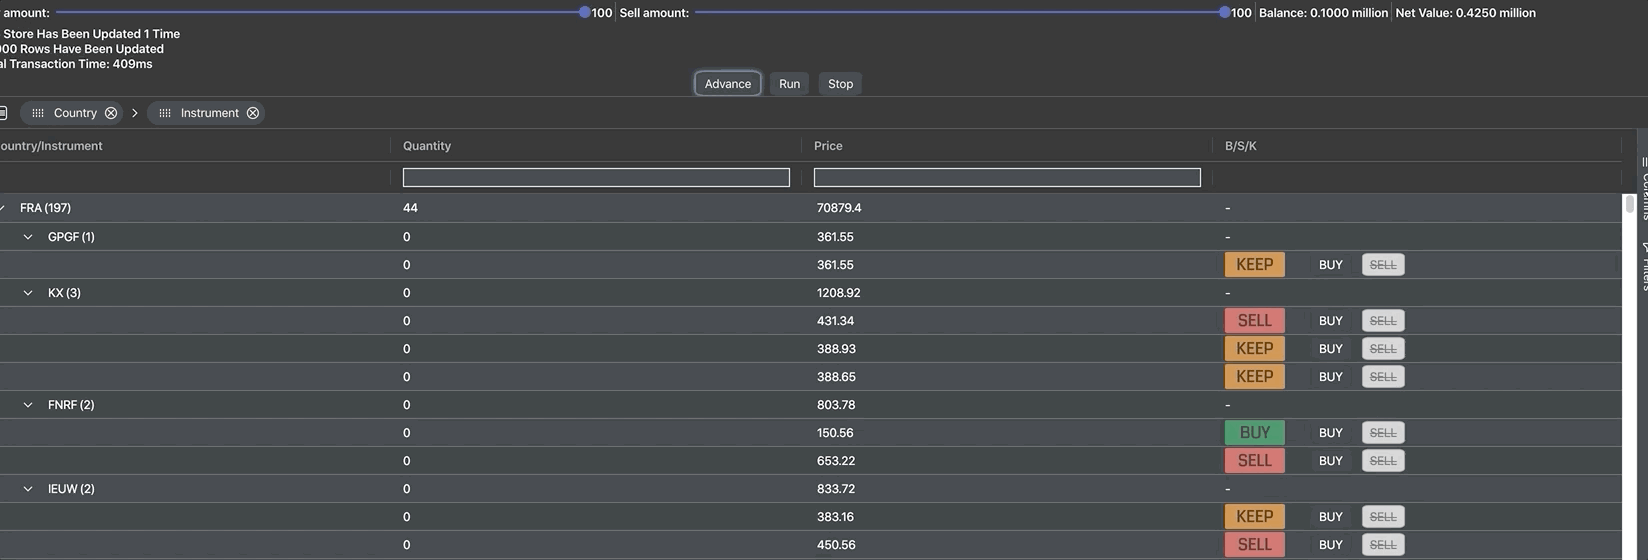
In this example, we were able to update each of the 50,000 rows 10 times, in 2550 milliseconds, you can see this for yourself by downloading and running this example from this repo.
Passing properties to React Renderers
Documentation: React Renderers
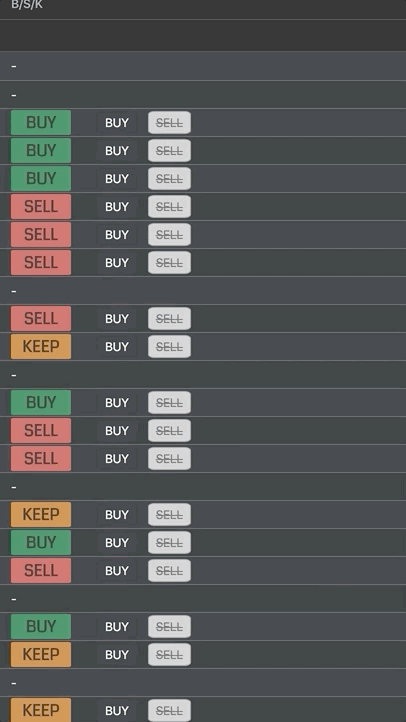
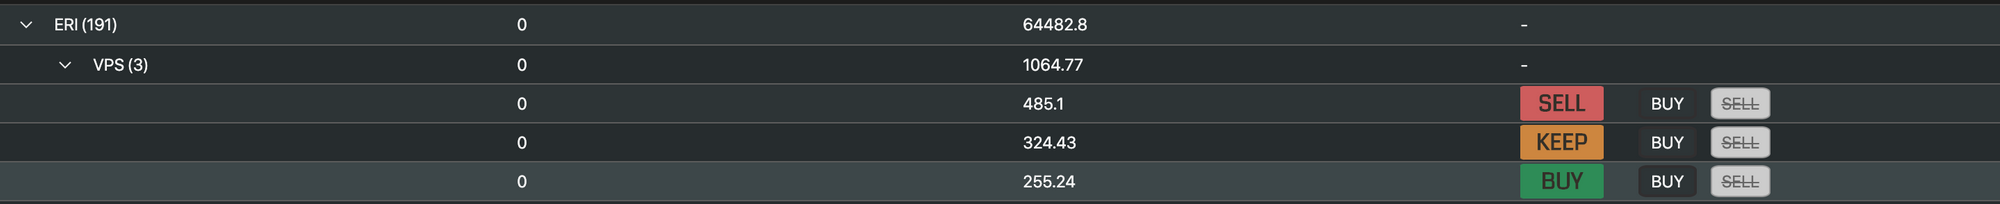
We're using a React component to display the buy/sell/keep recommendations and the buy/sell buttons seen in the B/S/K column.
Adding this component and hooking it up to the grid was as simple as registering the component and referencing it in the column definition, as shown below:
suppressAggFuncInHeader={true}
rowGroupPanelShow={'always'}
frameworkComponents={{ bskRenderer: BskRenderer }}
rowData={this.props.rowData}
onGridReady={this.onGridReady.bind(this)}
onCellValueChanged={this.onCellValueChanged}
deltaRowDataMode={true}
sideBar={this.sideBar}
floatingFilter={true}
groupDefaultExpanded={-1}
onModelUpdated={() => {
    if (startTime == null) return;
    let time = Date.now() - startTime;
    this.props.updateTimeTaken(time)

}}{
headerName: 'B/S/K',
valueGetter: params => bskGetter(params),
cellRenderer: 'bskRenderer',
filter: false,
cellRendererParams: (params) => {
return {
buyButton: (id, price) => this.props.onBuy(id, this.props.buyAmount, price),
sellButton: (id, price, quantity) => this.props.onSell(id, this.props.sellAmount, price, quantity),
getBalance: () => this.props.balance,
getSellAmount: () => this.props.sellAmount,
getBuyAmount: () => this.props.buyAmount
}
},
}When using the grid with React cell renderers it's possible to pass properties straight through them as you would in any React application. To do so, in this application we leveraged the Provider/Consumers components provided by React.
This can be seen in our Index.js and Buy/Sell/Keep renderer, which include the following lines of code:
const app = (
  <Provider store={store}>
    <App />
  </Provider>
);<ContextForRun.Consumer>
{(runningAndBalance) => (
<div>
{this.renderCell(runningAndBalance.running, runningAndBalance.balance)}
</div>
)}
</ContextForRun.Consumer>The running and balance properties change when different actions are taken in the app, for example when you click 'RUN', all renderers will receive a property value telling them that the application is running, so the buttons for BUY/SELL should be hidden.
If the user clicks STOP, the opposite will happen and the buttons will be shown again - see the code for this below:
renderCell = (running, balance, netValue) => {
        const grouped = <span>-</span>;
        const cell = <div className="bskCell">
            {this.recommendation(this.state.value)}
            {this.buyButton(balance)}
            {this.sellButton(netValue)}
        </div>;

        if (running != null) {
            if (!this.node.group) {
                return this.recommendation(this.state.value)
            } else {
                return <span>-</span>
            }
        };
        return this.props.node.group ? grouped : cell
    };
Reading Redux state from a renderer
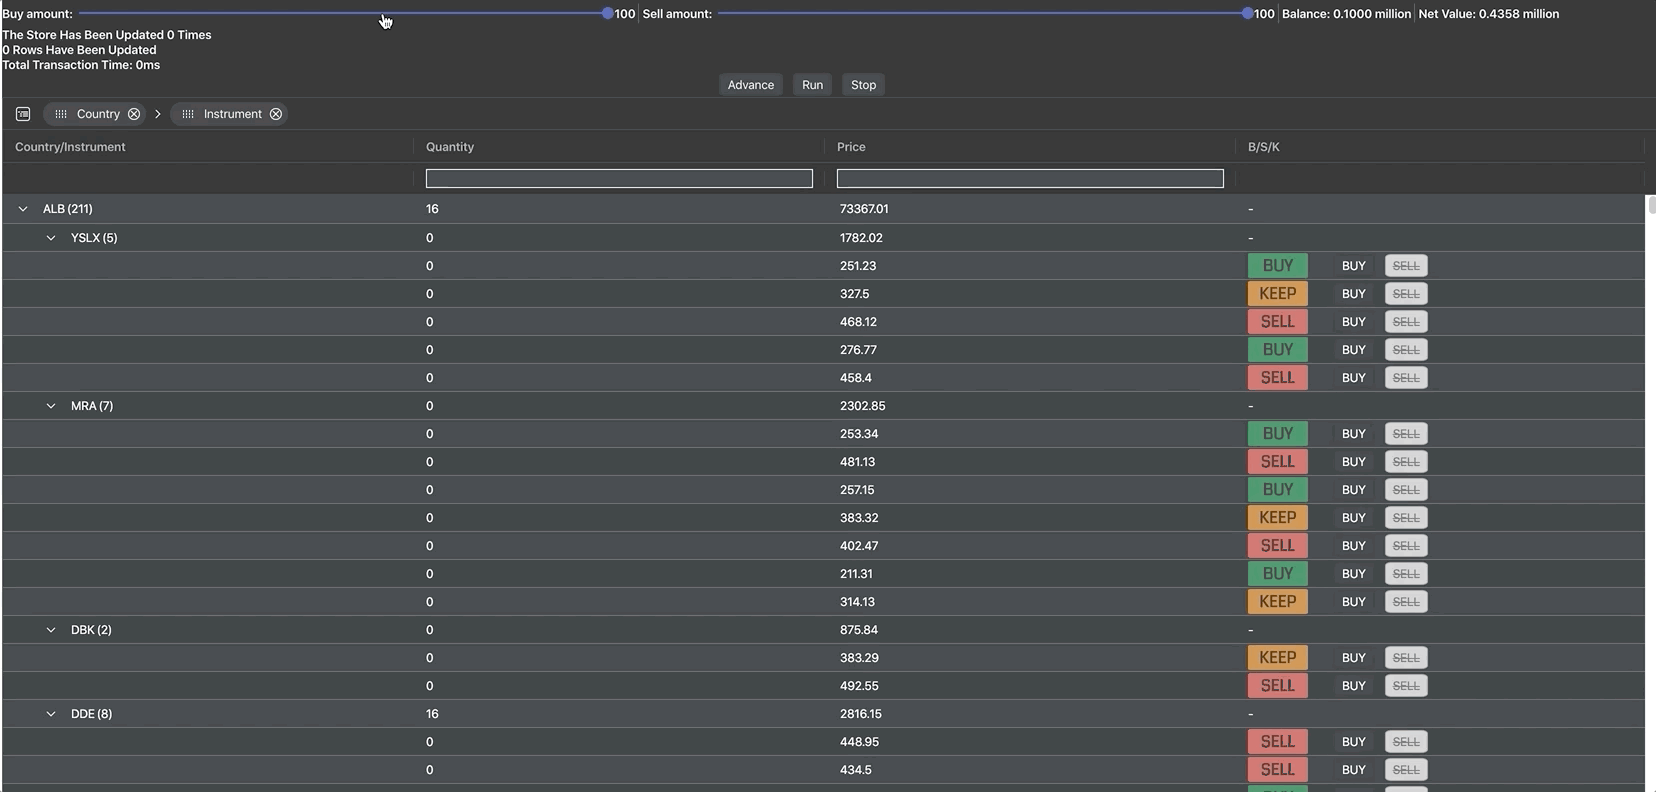
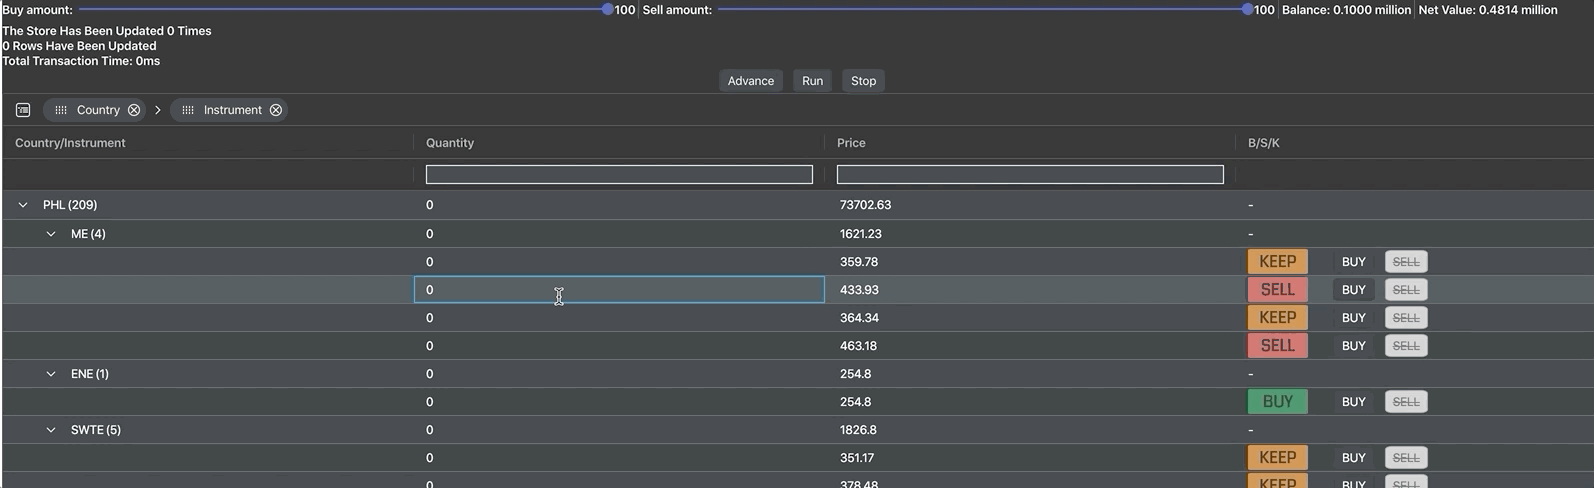
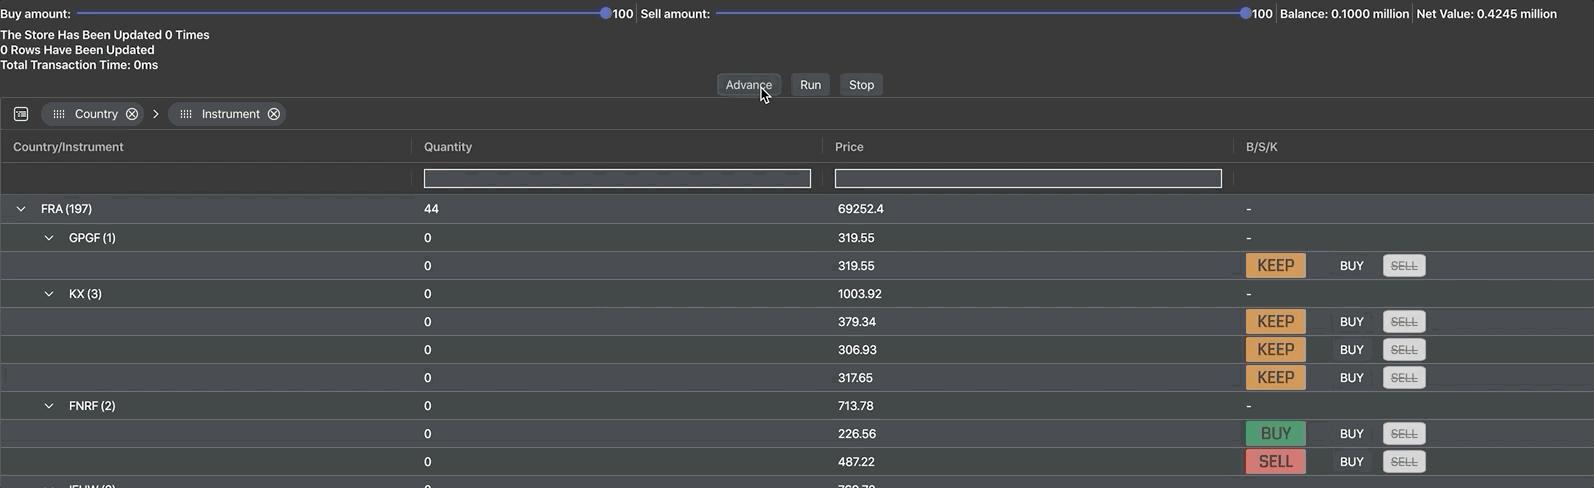
At the top of the example we can see two sliders, these were created using the Material UI library. They are used to choose the stock quantity the user buys or sells when using the BUY and SELL buttons found in each row.
This is done by updating the Redux store to reflect the new buy/sell amount when a slider is changed, this gives other components access to the updated value and allows it to be passed to the reducer method which are called when the buttons are clicked.
Editing in React
Documentation: Cell editing
Editing functionality is provided as standard by the grid, so adding it to the application is as easy as adding the property "editable" to the column definition of the quantity column as shown below:
{
    field: 'quantity',
    aggFunc: 'sum',
    filter: "agNumberColumnFilter",
    filterParams: {type: 'lessThan'},
    floatingFilterComponentParams: { suppressFilterButton: true },
    onCellValueChanged: (event) => {

                            if (isNaN(event.newValue)) {
                                this.props.handleNAN(event.data.id, event.oldValue)

                            }
                            if (event.oldValue < event.newValue) {
                                let buyAmount = event.newValue - event.oldValue
                                event.data.quantity = event.oldValue
                                this.props.onBuy(event.data.id, buyAmount, event.data.price)
                            }
                            if (event.oldValue > event.newValue) {
                                let sellAmount = event.oldValue - event.newValue
                                event.data.quantity = event.oldValue
                                this.props.onSell(event.data.id, sellAmount, event.data.price, event.data.quantity)
                            }

                        },
      valueParser: (params) => {return Number(params.newValue)},
      editable: () => {return (this.props.running) ? false : true}


}
We used the onCellValueChanged event to listen for when the user changes the quantity of a row.
Editing a quantity results in the application working out the amount of stocks the user would need to buy or sell to make the quantity correct and then performing that transaction.
Note, that in this example we're using default cell editors however, it would be possible to cancel the edit instead of changing the quantity value back manually after the edit, if we were to create our own custom cell editors.
Miscellaneous Grid Features
Documentation: (Row Grouping, Floating Filters and Side Bar, Show Change Cell Renderers):
We took advantage of how easily customisable the grid is, to add some more minor features to the application. All of these features can be found in the App.js file and are grid (found in the grid options) or column (found in the default column/column definitions) properties.
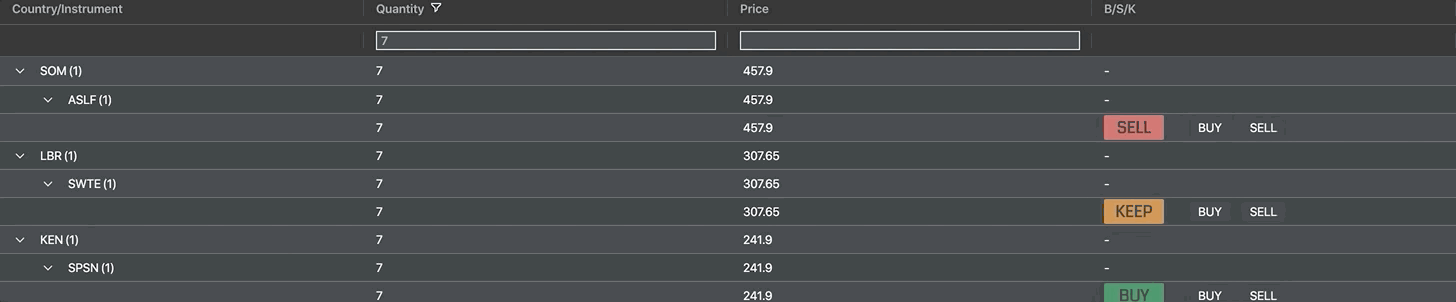
We added row grouping to show more clearly which countries owned which stocks.
We used a floating filter on the quantity and price columns to allow for the user to search for the quantities of stock they own already and search for the prices they want to buy stocks for.
We used a sidebar to allow the user to dynamically change the groupings or filter using a set filter on each column or pivot or even choose which columns they want to hide or show.
Finally, we used the provided show change cell renderer to show when prices are changed and how much they changed by, we think this gives the application a more authentic look.
If this project has inspired you to create your own using ag-Grid, you might find the getting started guides helpful: (JS / React / Angular / Vue).
Happy coding!