Last year we introduced embedded charting features into the grid. Now, we introduce a dedicated charting library.
AG Grid Charting Options
Last year we introduced charting features into ag-Grid. Just like Excel, we enabled users to create all the common chart types from inside the grid based on selected data ranges. We also allowed the charts to be customised interactively via the chart tool panel. This was ground-breaking — no other grid library supported this feature out of the box.
After the success of the grid charting feature, our users started asking us for more control and flexibility when creating charts. They wanted an API to directly control the chart, and ultimately to create charts independently of the grid.
This prompted us to start working on the Standalone Charting Library, extracting the library that powers the Integrated Charting feature in the grid, but with many more features and the control our users requested. We call it ag-Charts.
ag-Charts is a modern, lightweight and fast charting library built with HTML5 Canvas with no dependencies. ag-Charts can be used from vanilla JavaScript or TypeScript, or from one of the popular frameworks such as Angular, Vue or React using the thin framework wrappers that are provided with the library.
Framework Wrappers
For example, this code is all that's required to create a simple pie chart in React:
const options = {
    title: {
        text: "Apple's revenue by quarter (2019)"
    },
    data: [
        { quarter: 'Q1', revenue: 84.31 },
        { quarter: 'Q2', revenue: 58.02 },
        { quarter: 'Q3', revenue: 53.81 },
        { quarter: 'Q4', revenue: 64.04 }
    ],
    series: [{
        type: 'pie',
        angleKey: 'revenue',
        labelKey: 'quarter'
    }]
};

<AgChartsReact options={options} />
This produces the following chart:
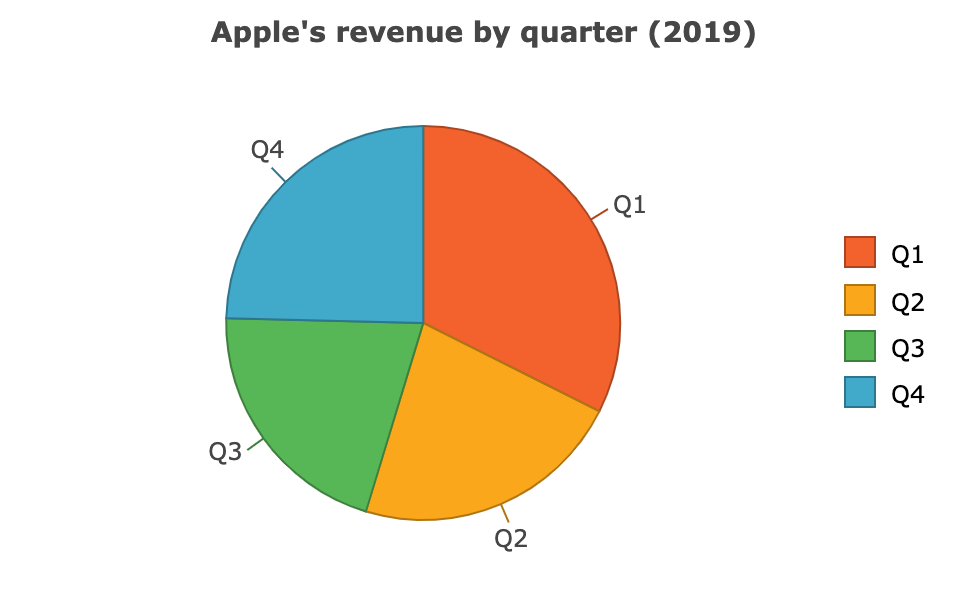
To create this chart in Angular or Vue, only the last line of code has to be swapped to use the relevant framework wrapper, the options object remains the same. This makes the charts code easily portable between frameworks and applications.
The chart will update automatically whenever the options object is changed.
API Explorer
The main focus and challenge during ag-Charts development was to make the public API as intuitive and approachable as possible while still allowing a great degree of control. You should find it easy to get going, even if you've never used a charting library before.
If you've used our Integrated Charting solution, you'll find that the Integrated and Standalone APIs are largely similar, so you should feel right at home from the start.
To make the learning process as easy as possible, we have created an API Explorer — an interactive way to explore the various capabilities of the library.
The API Explorer provides a playground and documentation in one. You can see the details of a particular bit of chart configuration and immediately see it in action by switching a toggle, dragging a slider, picking a colour or entering some text.
The API Explorer also generates code on the fly for all examples you interactively create or modify, so that you can see exactly what code changes are triggered by your actions. Framework-specific code generation is supported as well, and when you are done experimenting, you can simply copy and paste the generated code into your app.
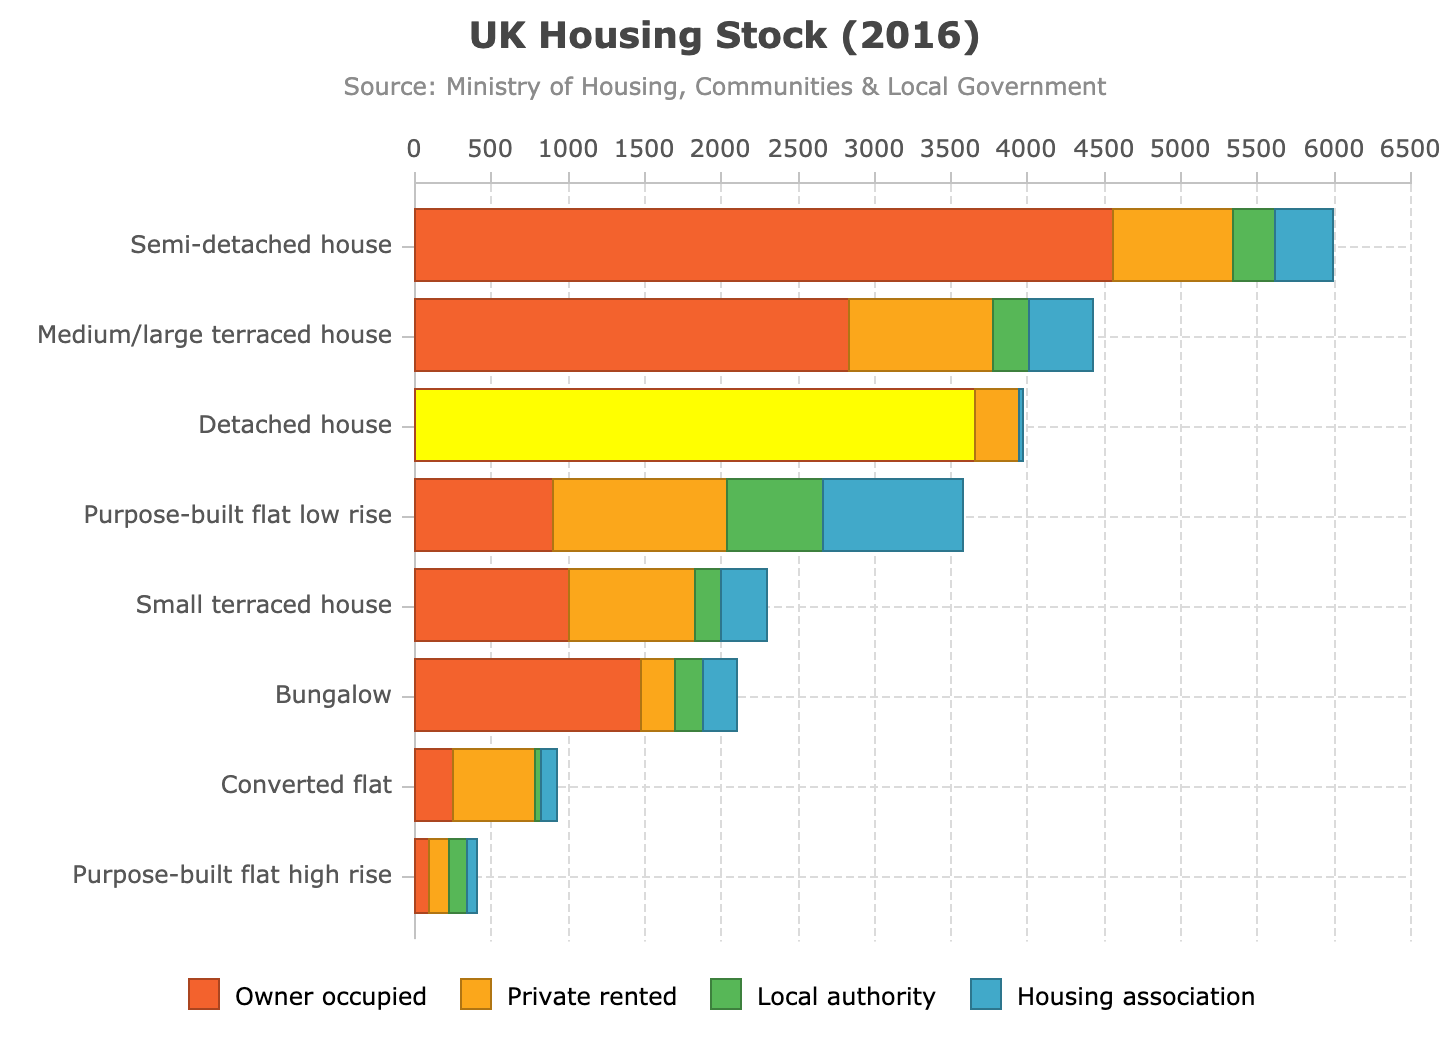
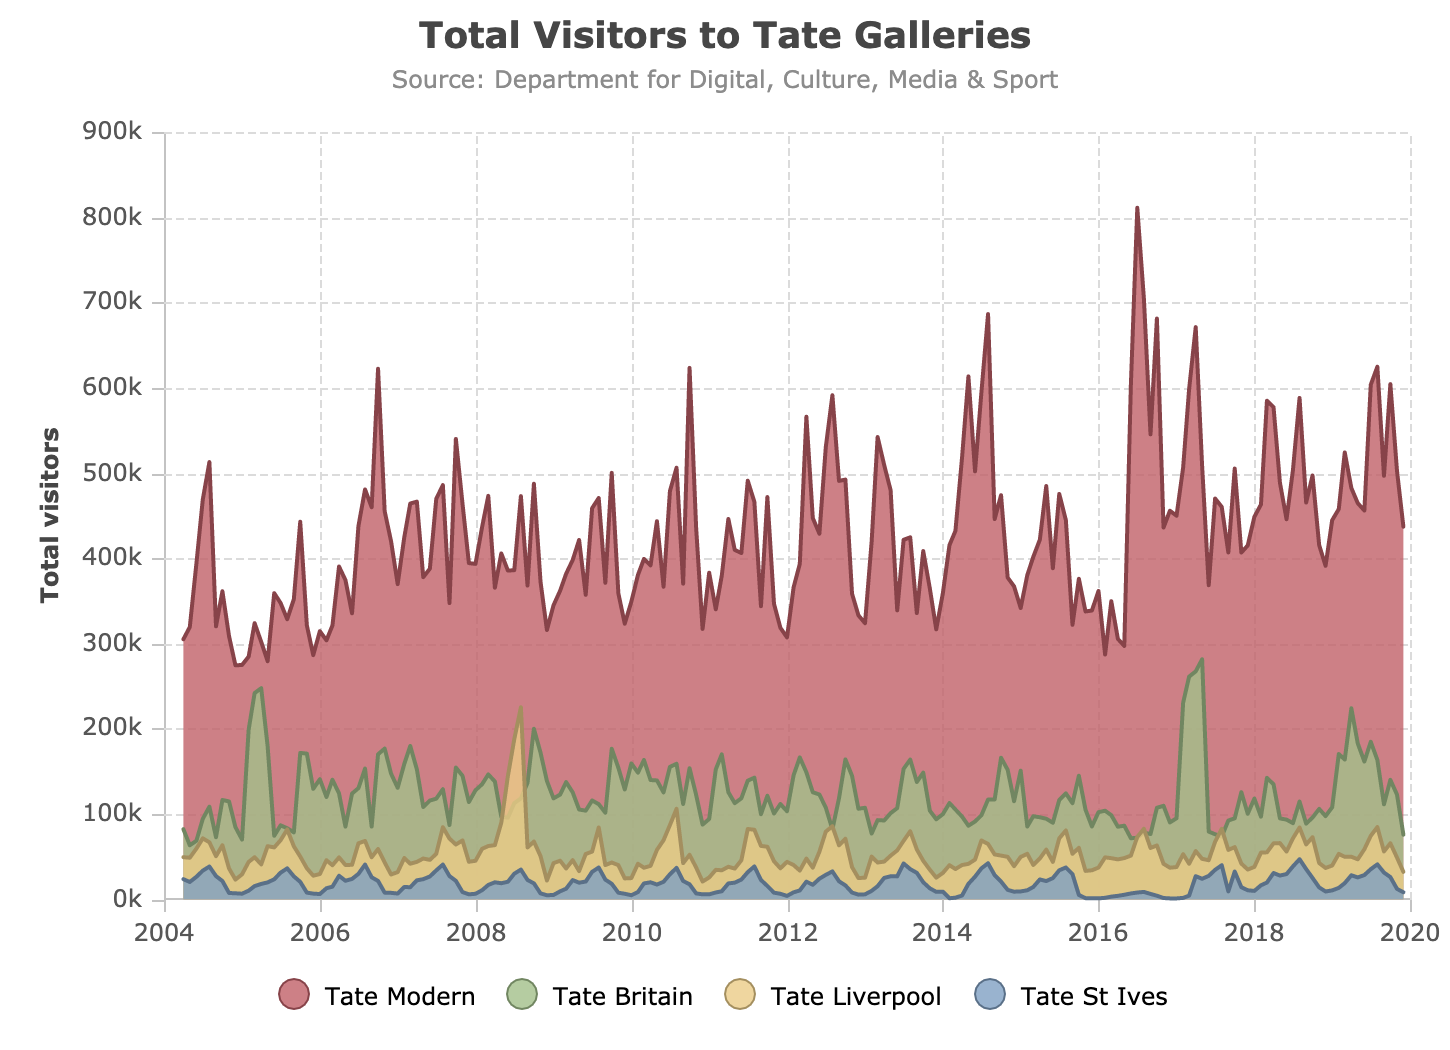
Chart Gallery
To demonstrate the true power of the library, we handcrafted a gallery of chart examples for you to explore. These examples use interesting real-world data and go above and beyond what's possible to create using the API Explorer alone.
In the gallery you'll find examples of combination charts, real-time charts, custom label and tooltip formatters, different marker styles and much more.
Here's a glimpse of some of the gallery's examples:
Every example comes in vanilla and framework-specific versions, and can be opened and tinkered with in Plunker.
Next Steps
ag-Charts is MIT licensed and is free for commercial and non-commercial use. Go to ag-Grid.com to start using it today.
We are very excited about this release and of what's to come, and are committed to adding more capabilities to the library in the future. This is just the beginning!
Learn more about AG Grid — high performance JavaScript Data Grid. We write the code to visualise data in interactive tables so you can concentrate on writing the application code. We support multiple frameworks: Angular, Vue, React so you can pick the best framework for your needs.