
Version 19
Customers love ag-Grid for its wide array of customization options and we work hard to make every bit of our data grid extensible. At ag-Grid we believe that developers should be able to extend default functionality with implementations specific to their use cases. Most of our functionality is already component based and you’ve probably added few customization components to your version of the data grid. This release is a major update that adds tool panel and status bar to the list of features that can be customized.
We’ve also worked on our server-side row model functionality that makes it possible to feed the data into the grid in batches. It’s appreciated most by our clients who have very large data sets on the server but don’t want to compromise on performance. The grid runs fast and smoothly. In this release we’ve added the support for data sets that have hierarchical relationships. Server side row model supports tree data now.
We’ve also renamed “ag-grid” to “ag-grid-community” to avoid confusion between “ag-grid” and “ag-grid-enterprise”. While it’s simply renaming on GitHub repository, we’ve created a new package on npm and deprecated the old one.
For a complete list of changes see our changelog.
Now let’s take a closer look at the new customization opportunities and the tree data in server-side model.
Side Bar customization
Tool Panel is one of ag-Grid’s UI elements that provides functionality for managing columns inside the grid. In this release we’ve renamed it to Side Bar and added the possibility to extend it with custom functionality. Side Bar consists of multiple tabs with each tab rendering a tool panel with custom components.
On the picture below you can see the familiar “Columns” tab in the side bar that renders a tool panel with columns configuration. Also two other tabs “Filters” and “Custom Stats” are added to the side bar:
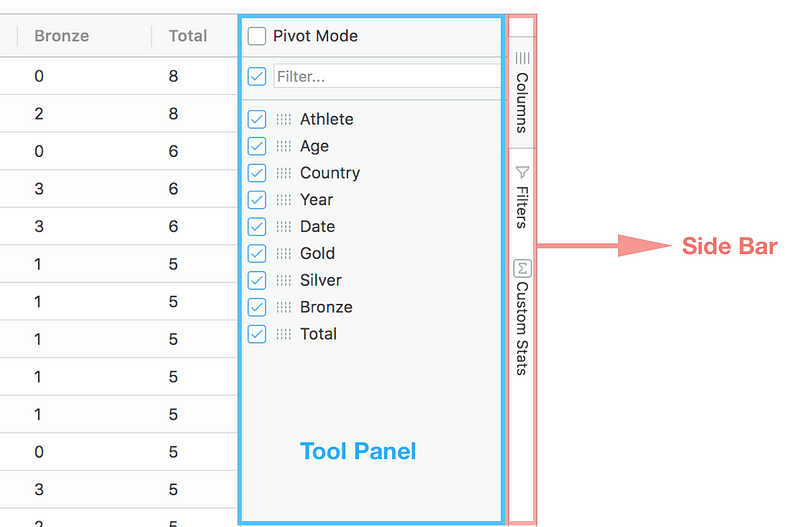
The new “Filters” tab the makes it possible for you to configure column filters from a single place. It’s especially handy when the grid is in the pivot mode as you can now use the toolbar to filter on the secondary columns.
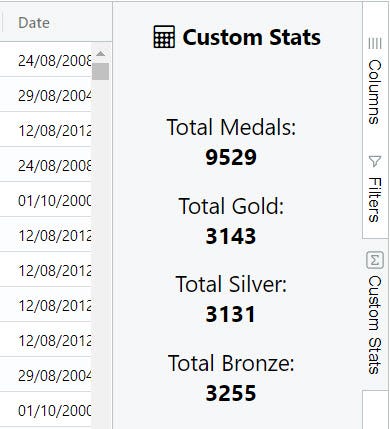
The other tab “Custom Stats” demonstrates customization capabilities. You can now add new tabs to side bar yourself and show custom components in the tool panel with functionality specific to your application.
For example, you can implement a component to show an aggregate information about the data:
To add the “Filters” and “Custom Stats” tab with components to the side bar, you just need to specify them in the new gridOptions.sideBar configuration option. The extension mechanism for the “Custom Stats” tool panel follows a familiar approach used everywhere in ag-Grid. You declare a component class that implements IToolPanel interface and register the component in the gridOptions.components.
So here’s a code snippet that adds both “Filters” and “Custom Stats” tabs to the side bar:
gridOptions: {
    sideBar: {
        toolPanels: [
            {
                // use the provided filters tool panel
                toolPanel: 'agFiltersToolPanel',
                ...
            },
            {
                // use a custom tool panel
                toolPanel: 'customStatsToolPanel',
                ...
            }
        ]
    },
    components: {
        // define the custom tool panel
        customStatsToolPanel: CustomStatsComponent
    }
You can read more about it in the documentation.
Status bar customization
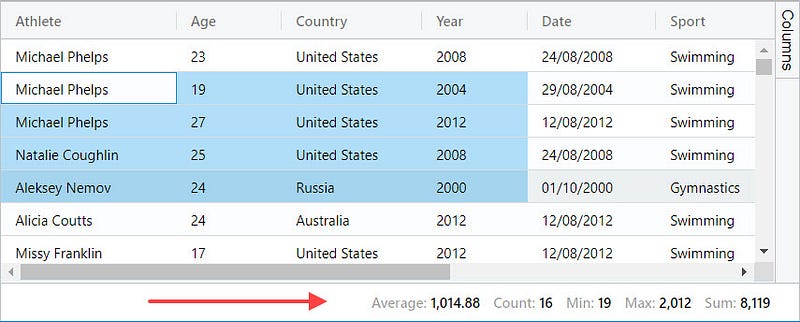
ag-Grid features the status bar that appears below the grid and shows information about the selected range of cells. It is enabled by setting enableStatusBar to true in the grid options and can be shown all the time or only when more than one cell is selected. When used in combination with the range selection it displays aggregation data about the selected range giving the following information: average, count, min, max, sum.
And until this release there was no way to provide custom functionality for the status bar. But it is possible now with the new Status Bar Components.
To extend the status bar, you need to declare a component class that implements IStatusBar interface with the getGui required method and register the component in the gridOptions.components array. To add the component to the status bar, you just add it to the gridOptions.statusBar.statusPanels configuration:
gridOptions: {
    statusBar: {
        statusPanels: [
            { statusPanel: 'lastSaveTimeStatusBarComponent', ... }
        ]
    },
    components: {
        lastSaveTimeStatusBarComponent: SaveTimeStatusBarComponent
    }
The getGui method of the component is called and the returned HTML is rendered in the status bar:
class SaveTimeStatusBarComponent {
  getGui() {
    // return HTML that renders last saved time
    return ...
  }
}
And the custom component is added to the status bar:
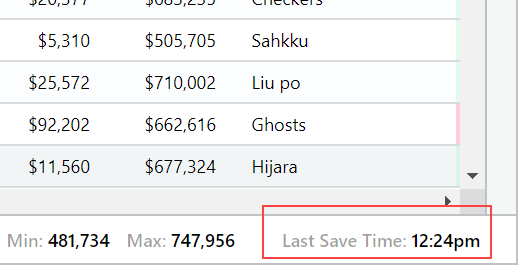
You can read more about it in the documentation.
Server-side tree data
ag-Grid has long supported data with hierarchical relationships between entities, i.e. Tree Data. But one limitation in the existing solution is that you have to provide all the data in advance when using the default client-side row model. However many enterprise users of ag-Grid with big data volumes
use the server-side row model to supply the data to the grid in batches (blocks). Until this release there was no way to lazy-load hierarchical data.
But it’s possible now. Enabling tree data in ag-Grid for server side row model is as easy as implementing two callbacks used to determine the hierarchical relationships.
var gridOptions = {
    // indicate if row is a group node
    isServerSideGroup: function (dataItem) {
        return dataItem.group;
    },

    // specify which group key to use
    getServerSideGroupKey: function (dataItem) {
        return dataItem.employeeId;
    }
    ...
}
For each new fetched record ag-Grid runs the isServerSideGroup callback and the returned value is used to determine whether the record has associated child records or not.
The other callback getServerSideGroupKey defines the key used for grouping. For example, if you have the following database with employeeId being a foreign key to denote relationship:
+-----+-----------------+------------------------+
| id | name | employeeId (reportsTo) |
+-----+-----------------+------------------------+
| 100 | Kathryn Powers | null |
| 101 | Addie Meyer | 100 |
| 102 | Troy Walsh | 101 |
| 103 | Joshua Matthews | 102 |
| 104 | Mitchell Wong | 102 |
| 105 | Marc Hill | 102 |
+-----+-----------------+------------------------+
the callback should return employeeId as a grouping key.
You can read more about it in the documentation.
Learn more about AG Grid — an Enterprise Data Grid used by over 50% of the Fortune 500. We write the code to visualise data in interactive tables so you can concentrate on writing the application code. Multiple framework support: Angular, Vue, React - pick the best framework for your needs.