
Hey there! Just a few days ago we released a completely new version 18 of ag-Grid. This is a major update, so besides fixing a bunch of bugs and improving performance through underlying architectural changes, we’ve added a number of very interesting features. Most of the work was focused around the pivot table mode and filtering. Let me walk you through the new features.
For a complete list of changes see our changelog.
- Multiple filtering conditions
- Grand column totals
- Pivot Totals
- Row Spanning
- Printing
- Embracing Flex layout
Multiple filtering conditions
Previously, you could only define one condition for a column filter. Now, Text, Number and Date column filters support two conditions which can be grouped using AND/OR grouping operator.
In the example below, we’re filtering out records to only show “Celica” and “Mondeo” models. And we use OR filtering operator to show records that match both conditions.
You can read more about it in the documentation.
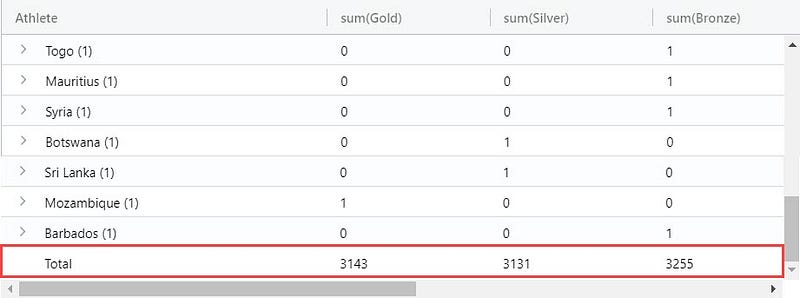
Grand column totals
Previous versions of the grid gave you the ability to find out subtotals for each group:
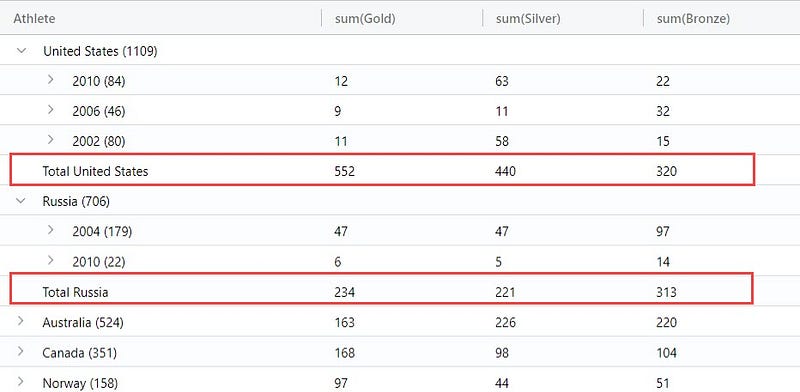
We have now added the grand total for columns across all groups:
You can read more about it in the documentation.
Pivot Totals
We continue advancing our ag-Grid’s pivot table functionality to make the analytics process even more efficient. This time we’ve added support for grand totals across column and row groups.
Column group totals
Suppose you have the following data in the grid:
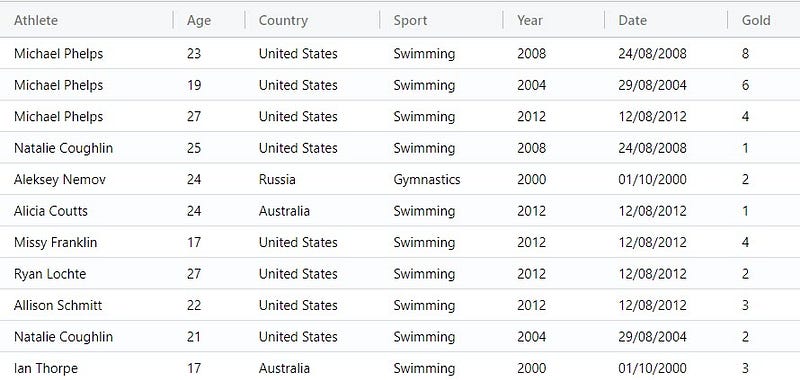
Now you want to see how many gold medals each country won in each year. For that you need to group by a country and pivot on a year. If you do that here is what you will have in the grid:
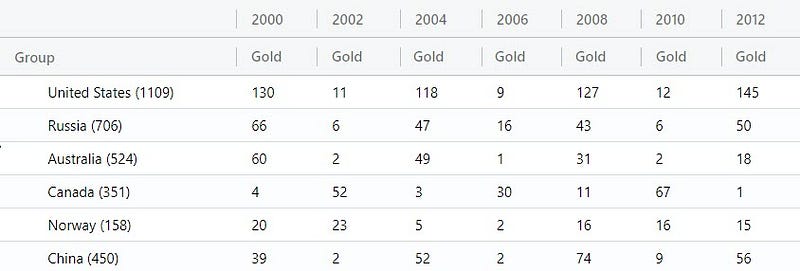
The pivot table shows us that the United States won 130 gold medals in 2000.
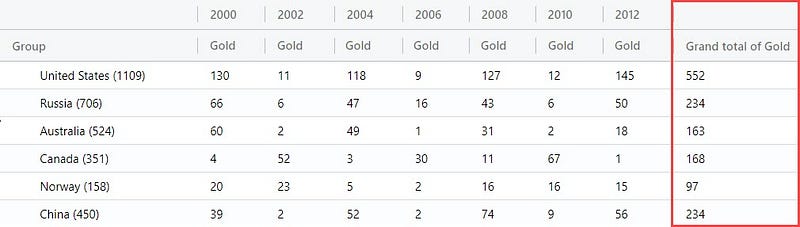
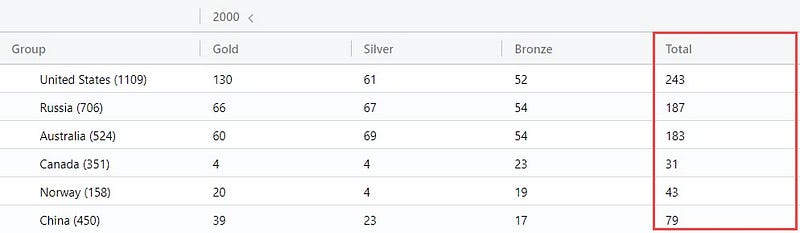
But what if you now want to see the total of gold medals won by the United States for all years? In this release we have added the new grand total option for column groups. When applied, the grid has a new column that shows the grand total for all years:
Row Totals
Based on the same set of data, imagine that we also need to add Silver and Bronze medals to the picture. So you have the following representation of the grid:
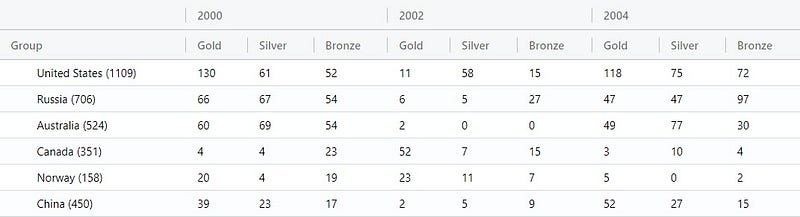
What if you now want to know how many medals of all kinds a country won in each year? This kind of total values is another new feature that we’ve introduced. Once enabled, you will have a new column added showing you totals across all medals within a year.
And it also includes a handy sliding mechanism that allows expand or collapse all values within a pivoted group. In our example with medals, you can show or hide details for each kind of medals within a year.
You can read more it in the documentation.
Row Spanning
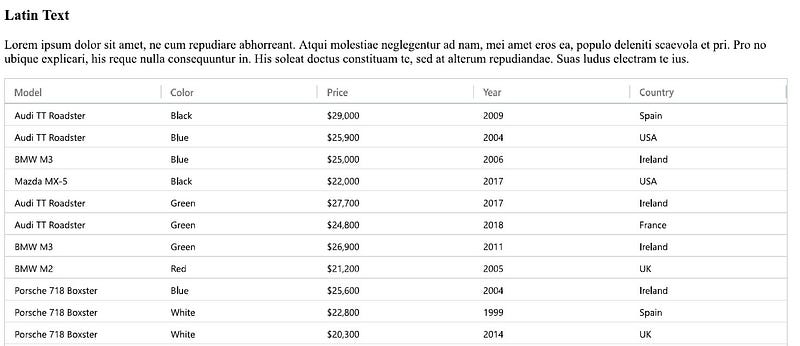
By default, each cell takes up the height of one row. You can now change this behavior to allow cells to span multiple rows. This feature is similar to ‘cell merging’ in ‘Excel or ‘row spanning’ in HTML tables.
On the screenshot below the cells that span multiple rows are highlighted in cyan. You can see the first cell spans 2 rows, second and third span 4 rows.
You can read more about it in the documentation.
Printing
When the data shown in a grid needs to printed, it’s often desirable to not constrain grid dimensions on the web page so that when printed it shows full set of data. A grid with unrestricted height and weight also doesn’t have scrollbars as they make no sense on a printed paper.
For example, instead of having a grid printed with scrollbars:

You want the grid to occupy the space it requires to show full data set:
Previously you only could pass width and height dimensions as configuration options only before the grid was initialized. You can now do it dynamically after the grid has been initialized.
Check out the documentation to learn how to do it.
Embracing Flex layout
In this release we’ve also boosted the grid’s performance even further by redesigning part of ag-Grid’s internal layout mechanism with CSS Flexible Box Layout (Flexbox). As you know, Flexbox has been around for quite a while but we couldn’t take advantage of it because IE9 didn’t support it. Now that we have dropped the support for this version of Internet Explorer as no one uses it, we can delegate most of the heavy lifting of layouting to native browsers implementation. The new layout structure doesn’t need a polling setTimeout function running every 500 ms and a bunch of redundant wrapper DIV elements. That’s where the performance improvements come from.
Learn more about AG Grid — High Performance Enterprise JavaScript Data Grid. Supporting multiple frameworks: Angular, Vue, React so you can pick the best framework for your needs.