
AG Grid 29.2 is an important minor version with many stability improvements and highly-requested new features:
1. Header checkbox selection and group selection when using server-side row model
2. Entering more than two filter conditions in a column filter
3. Vertically-spanning column header cells
4. Displaying "No Data" overlay in the chart when there's no data
5. Displaying stacked and unstacked column series together in the chart
As this is a minor version, there are many quality and performance improvements and no breaking changes. We recommend reviewing the list of new features and deprecations in the release notes when planning to update to this version.
Please see the full list of changes in our changelog.
Header Checkbox Row Selection with the Server-side Row Model
AG Grid 29.2 adds support for select all/deselect all rows when using server-side row model. This allows you to have all the rows selected even if they're not loaded from the server yet. See this demonstrated here and shown below:
Group Row Selection with the Server-side Row Model
AG Grid 29.2 adds support for group row selection when using the server-side row model. This allows you to accurately implement row selection when using larger server-side datasets. See this demonstrated here and shown below:
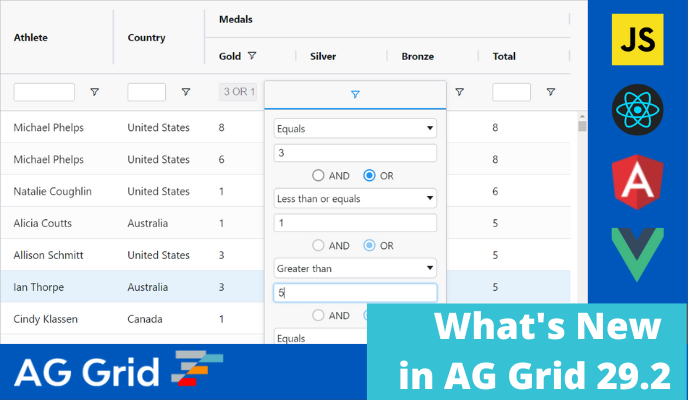
Entering Many Conditions in a Column Filter
AG Grid 29.2 adds support for entering more than two conditions in the column filter. This allows end-users to enter more powerful filters and find the data they need more quickly. See this documented here and shown below:

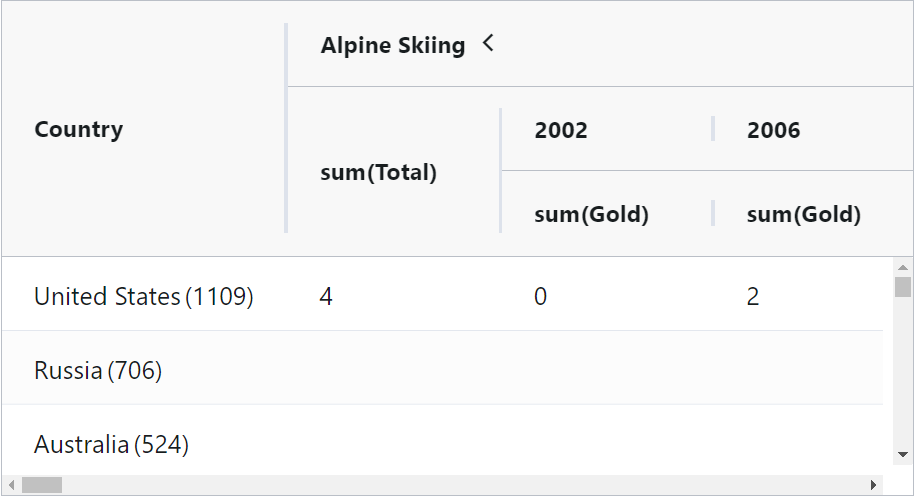
Vertically-spanning Column Header Cells
AG Grid 29.2 adds an optional column header mode to span the column header to occupy vacant space if there's no parent column group header. This mode produces a simpler, visually-attractive column layout, as shown below. This new mode is documented here and an example column header layout is shown below.
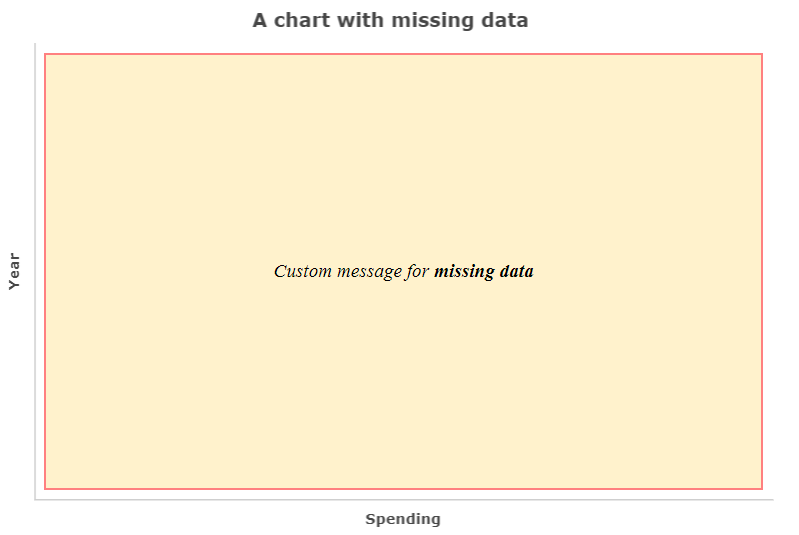
Displaying a "No Data" Overlay in the Chart
AG Charts adds the ability to display overlays with a message for the user when there's no data or no series displayed in the chart. This is documented here and shown below:
Displaying Stacked and Unstacked Column Series in the Chart
AG Charts now allows you to display stacked and unstacked column series in the same column group in the chart. See this documented here and shown below:
Summary
AG Grid 29.2 delivers major new features to help you build more powerful and better-looking grid and chart UIs. It addresses many issues and makes important enhancements to current functionality. This is why we highly recommend upgrading to this version soon.
We suggest reviewing the list of new features in the release notes when planning to update - see the full list of changes in our changelog.
As always, we’re keen to help you upgrade and to hear your feedback.
Happy coding!