
AG Grid 28.2 is a minor version which adds support for SolidJS, enhances chart functionality and allows to customize the integrated chart UI. There are also many improvements in performance and stability.
As this is a minor version, there are no breaking changes from AG Grid 28, so this version is easy to upgrade to. You can view the full list of new features and issues fixed in the changelog.
AG Grid Support for SolidJS
SolidJS is a Reactive JavaScript library which uses JSX to create DOM nodes directly rather than using a Virtual DOM, which performs better than React. SolidJS Functional Components execute once avoiding all Stale Enclosure problems associated with React Functional. Also, SolidJS code looks similar to React Functional code, giving an easy migration from React, but you end up with code that is easier to maintain and faster applications. What is there not to like!!
AG Grid now has full support for SolidJS and we've added documentation with examples and a video to present this.
AG Grid Solid is NOT a JavaScript component with a thin Solid wrapper. AG Grid is the Real Deal when it comes to a Data Grid Implementation for SolidJS because when using AG Grid with Solid, all of the grid's core rendering (headers, rows, cells etc) is rendered using Solid.
AG Grid Solid shares the same 'business logic layer' as the other AG Grid versions (React, Angular, Vue, or just JavaScript). This means the features of AG Grid Solid are identical to the features in AG Grid's other framework flavours. However because the rendering is done 100% in Solid, the grid works as a native Solid Component.
Improvements to Excel Export
In AG Grid 28.2 we improved Excel export functionality. You can now provide different styles for column headers when exporting to Excel, allowing you to customize the appearance of the exported content.
Also, you can now choose between exporting either the filtered or full set of rows when the grid has a column filter and sorting applied. This will give you extra flexibility to customize what exactly gets exported. See this shown below:
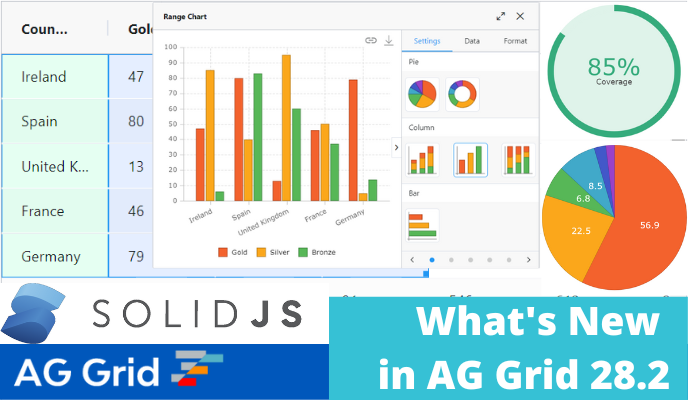
Customizing Integrated Chart Tool Panels
As part of AG Grid 28.2, the chart allows you to customize the integrated chart tool panels. You can now always show the chart tool panels, reorder or hide series types or tabs of the chart tool panel as well as set the default tab to open.
We've also introduced a new mode to display/hide the chart tool panel and always display the chart toolbar, as shown below:
This makes the integrated chart more configurable for your particular needs and improves the user experience as a whole.
Pie and Doughnut Charts Labels
In AG Grid 28.2 pie charts can now display labels inside pie slices. This way you can present your data better without using external pie labels as shown below:
Also, doughnut charts can now display a label inside the inner circle. This allows you to display the exact value of the doughnut or show the name of the measure the doughnut is showing:
Summary
AG Grid 28.2 adds support for SolidJS and important new charting functionality. It also delivers many improvements to stability and performance.
As this is a minor version, there are no breaking changes from AG Grid 28 and it should be easy to upgrade to this version. This is why we recommend upgrading to AG Grid 28.2 to improve the quality of your application and deliver a better user experience.
As always, we’re keen to help you upgrade and to hear your feedback.
Happy coding!