
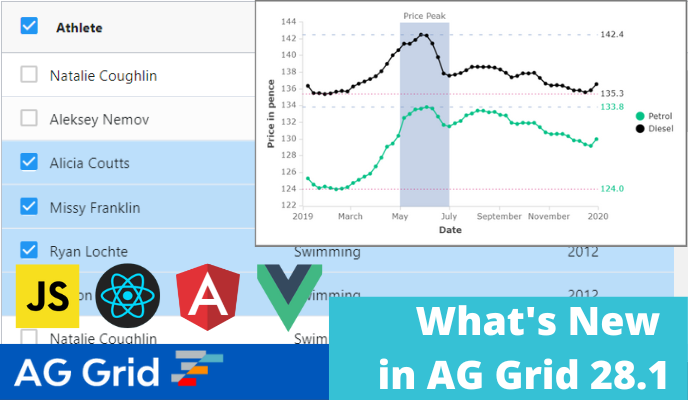
AG Grid 28.1 is a minor version which allows showing disabled checkboxes in the grid and crossing lines in the chart. Just as importantly, it adds many stability and performance improvements which can improve your applications.
As this is a minor version, there are no breaking changes from AG Grid 28, so this should be easy to upgrade to. We recommend reviewing the full list of new features and issues fixed in the changelog.
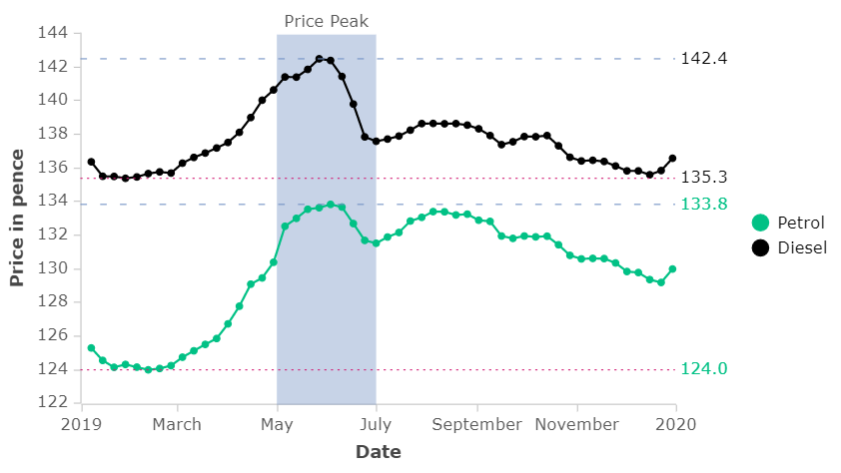
Cross Lines and Ranges in Charts
As part of AG Grid 28.1, the chart allows you to display cross lines and regions. You can use these to indicate important threshold values in the chart to add context and allow users to more easily understand the chart data.
Displaying disabled checkboxes instead of no checkboxes
In AG Grid 28.1 when you use checkbox row selection, you can display disabled checkboxes for rows which aren't selectable. Previously when a row wasn't selectable, no checkbox was displayed. See this illustrated below:
Restoring initial scrolling position when using infinite scrolling
AG Grid 28.1 allows setting the initial page and scrolling position when using the server-side row model with infinite scrolling. This allows you to restore the previous current page or scrolling location in the grid when the user reloads the page. See this demonstrated here.
Summary
AG Grid 28.1 adds new functionality and many improvements in stability and performance. Upgrading to AG Grid 28.1 will improve the quality of your application and help you deliver a better user experience.
We recommend reviewing the list of deprecations and breaking changes in the release notes when planning to update to this version. Please see the full list of changes in our changelog.
As always, we’re keen to help you upgrade and to hear your feedback.
Happy coding!