
AG Charts 9 is a major step forward in charting - it adds an Enterprise charts version with multiple new series types and many new end-user features to deliver a powerful and interactive charting experience:
1. New Enterprise Series Types
2. Zoom
3. Context Menu
4. Crosshairs
5. Initial Load and Data Update Animation
6. Error Bars
7. Background Images
As this is a major version there are breaking changes for anyone upgrading. We recommend reading our migration guide and reviewing the list of changes in the release notes when planning to update to this version.
New Enterprise Series Types
AG Charts Enterprise includes many new series types to provide a comprehensive set of options to visualize your data. See the list of new series below:
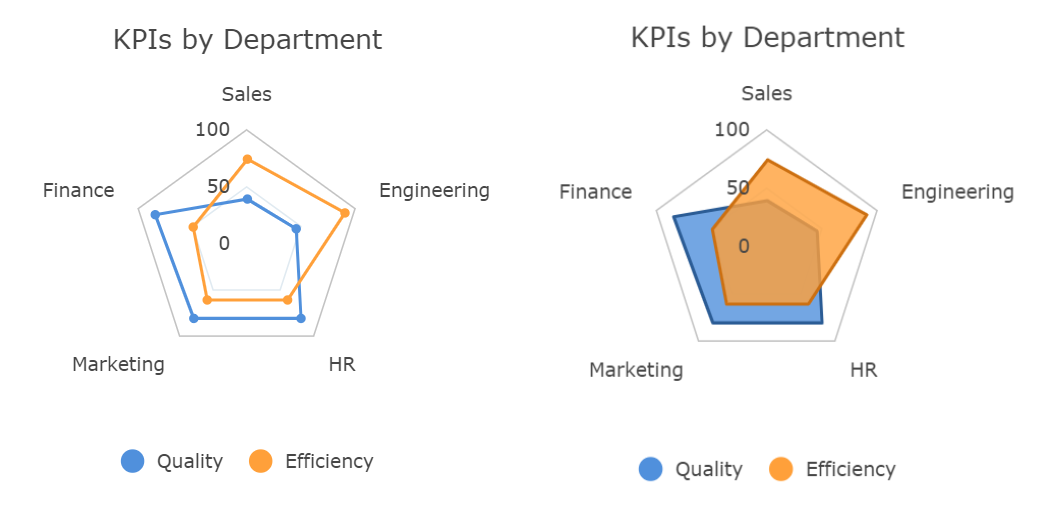
Radar Line and Radar Area
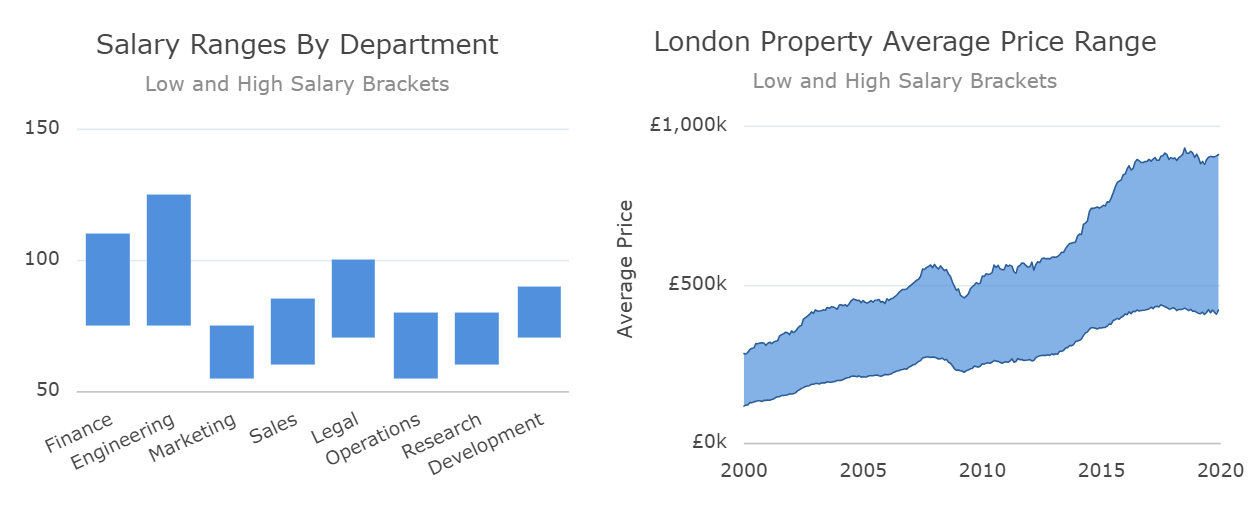
Range Area and Range Bar
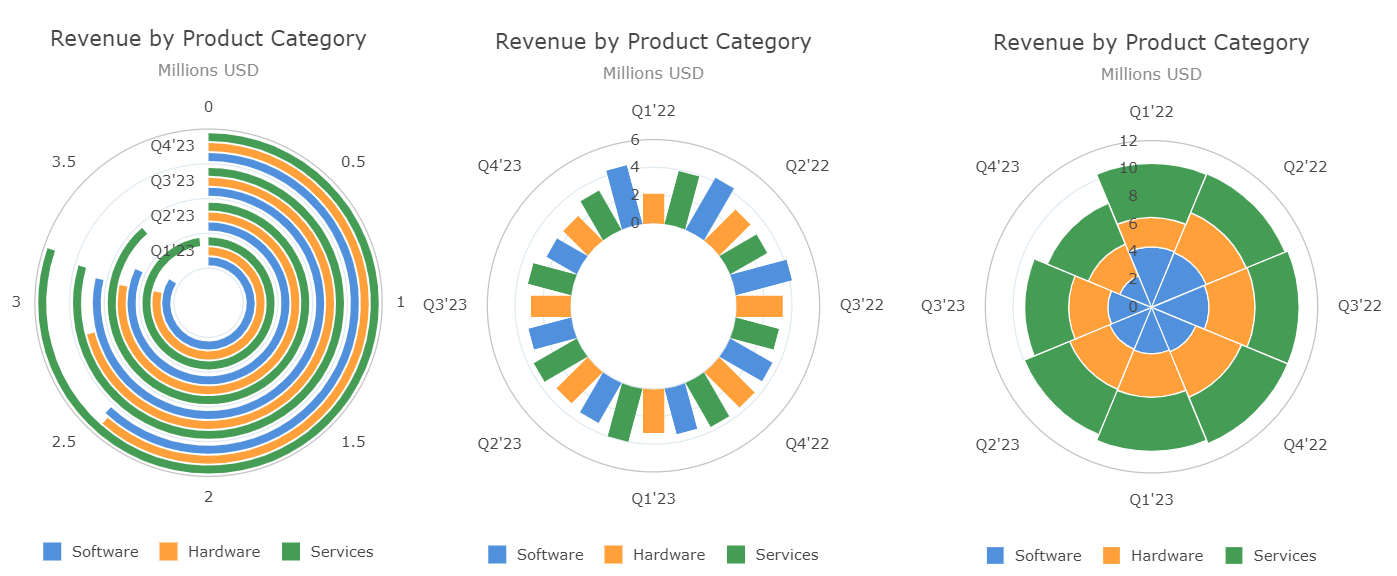
Radial Bar, Radial Column and Nightingale
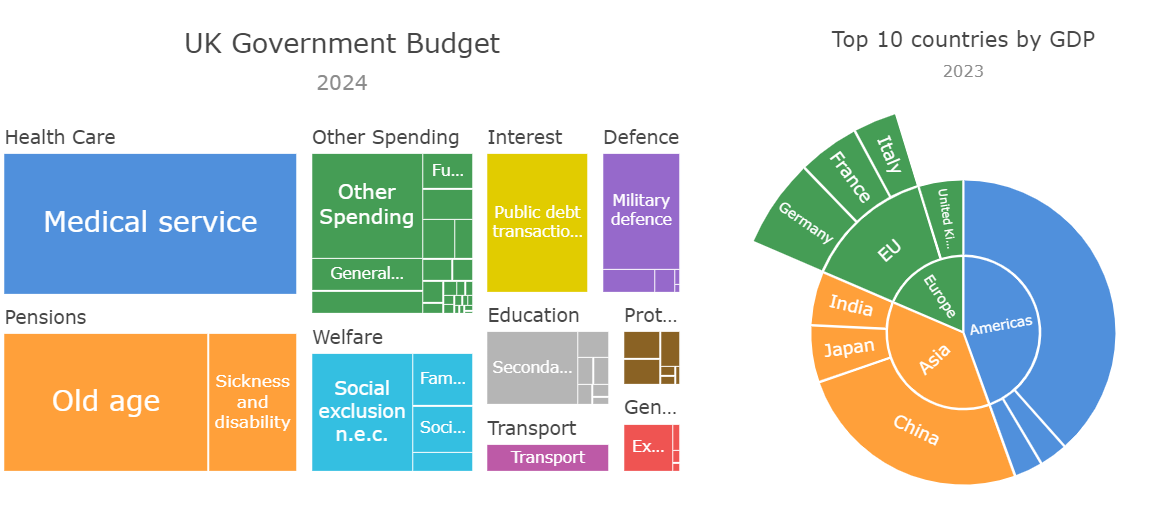
Treemap and Sunburst
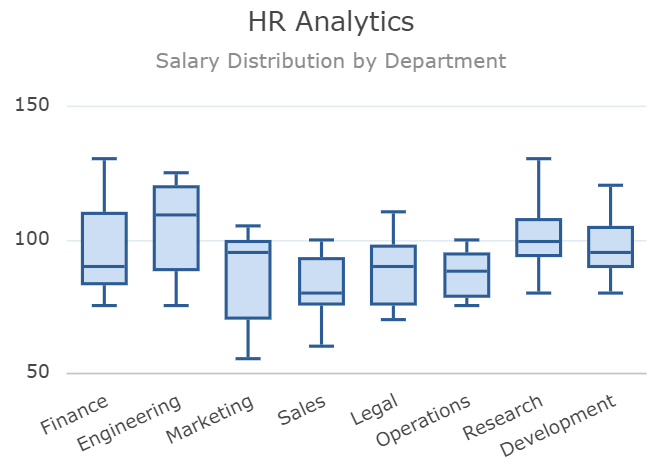
Box Plot
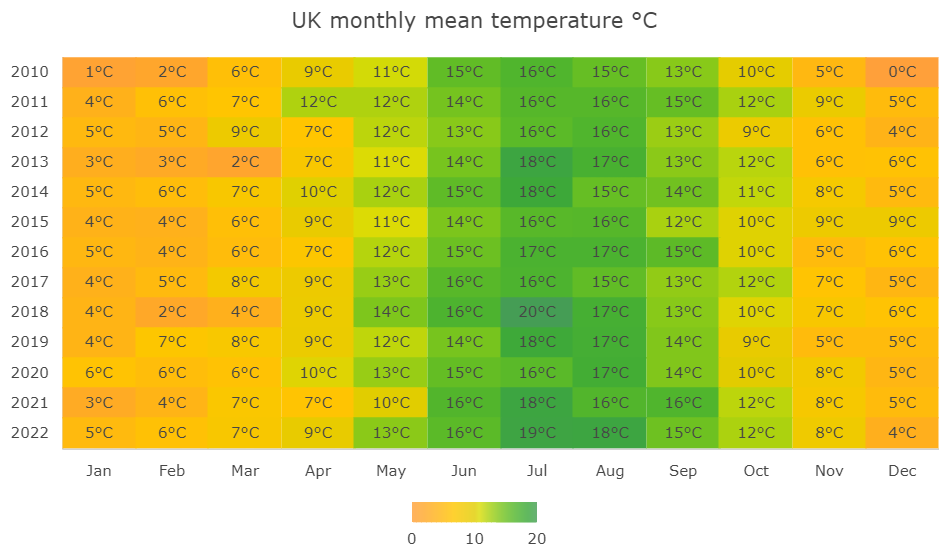
Heatmap
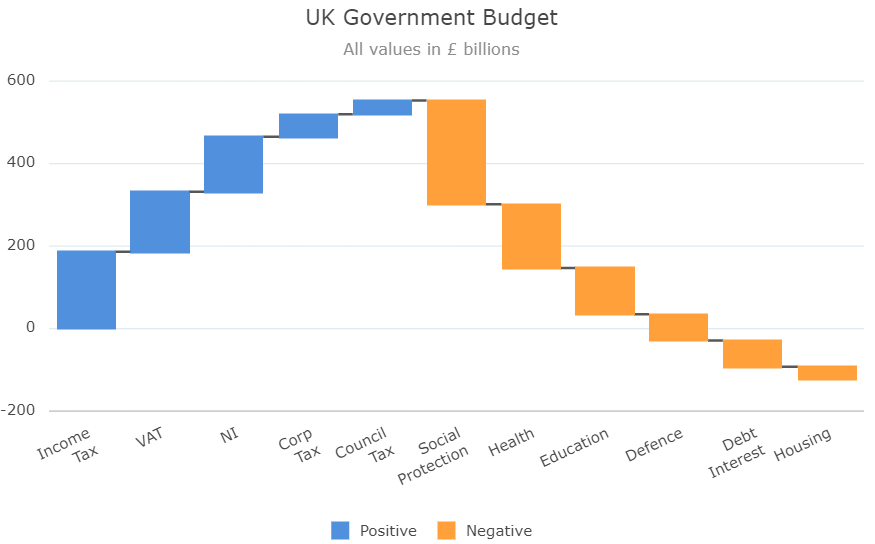
Waterfall
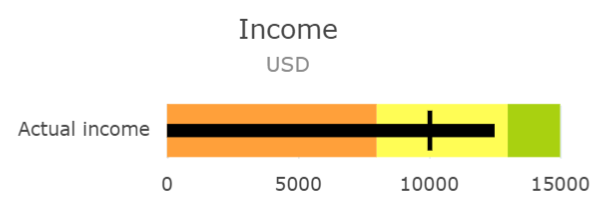
Bullet
Zoom
AG Charts Enterprise adds zoom to charts to help users explore large amounts of data more easily. Users can zoom and pan using the mouse wheel, dragging on the axes or selecting an area of the chart. For all the possible options, see our documentation here.
Context Menu
AG Charts Enterprise includes a built-in Context Menu. This allows developers to add interactivity to the chart, with custom menu items based on the chart elements. This is documented here.
Crosshairs
AG Charts Enterprise allows showing crosshairs over the chart together with floating labels over the axes at the mouse pointer location. This allows users to get the exact axis value reading at any point in the chart area, which helps precisely distinguish points which are close together. This is shown below and documented here.
Initial Load and Data Update Animation
AG Charts Enterprise adds animated charts. The charts animate on initial load and when the data is updated. This gives your users a more engaging and responsive visual experience. This is shown below and documented here.
Error Bars
AG Charts Enterprise allows adding Error Bars to chart series. This allows showing confidence intervals around points in a series, displaying your data with additional context to users. This is shown below and documented here.
Background Image
AG Charts Enterprise allows adding a background image to the chart. This is useful if you want to add branding or a watermark to your charts. This is shown below and documented here.
Summary
AG Charts 9 is an important major version - it adds many Enterprise features for a more powerful, engaging and interactive user experience. In addition, there are many improvements in performance, stability and quality of existing features.
If you're upgrading from a previous version of AG Charts, we recommend reviewing the migration guide when planning to update. You can also see the full list of changes in our changelog.
As always, we’re keen to help you upgrade and to hear your feedback.
Happy coding!