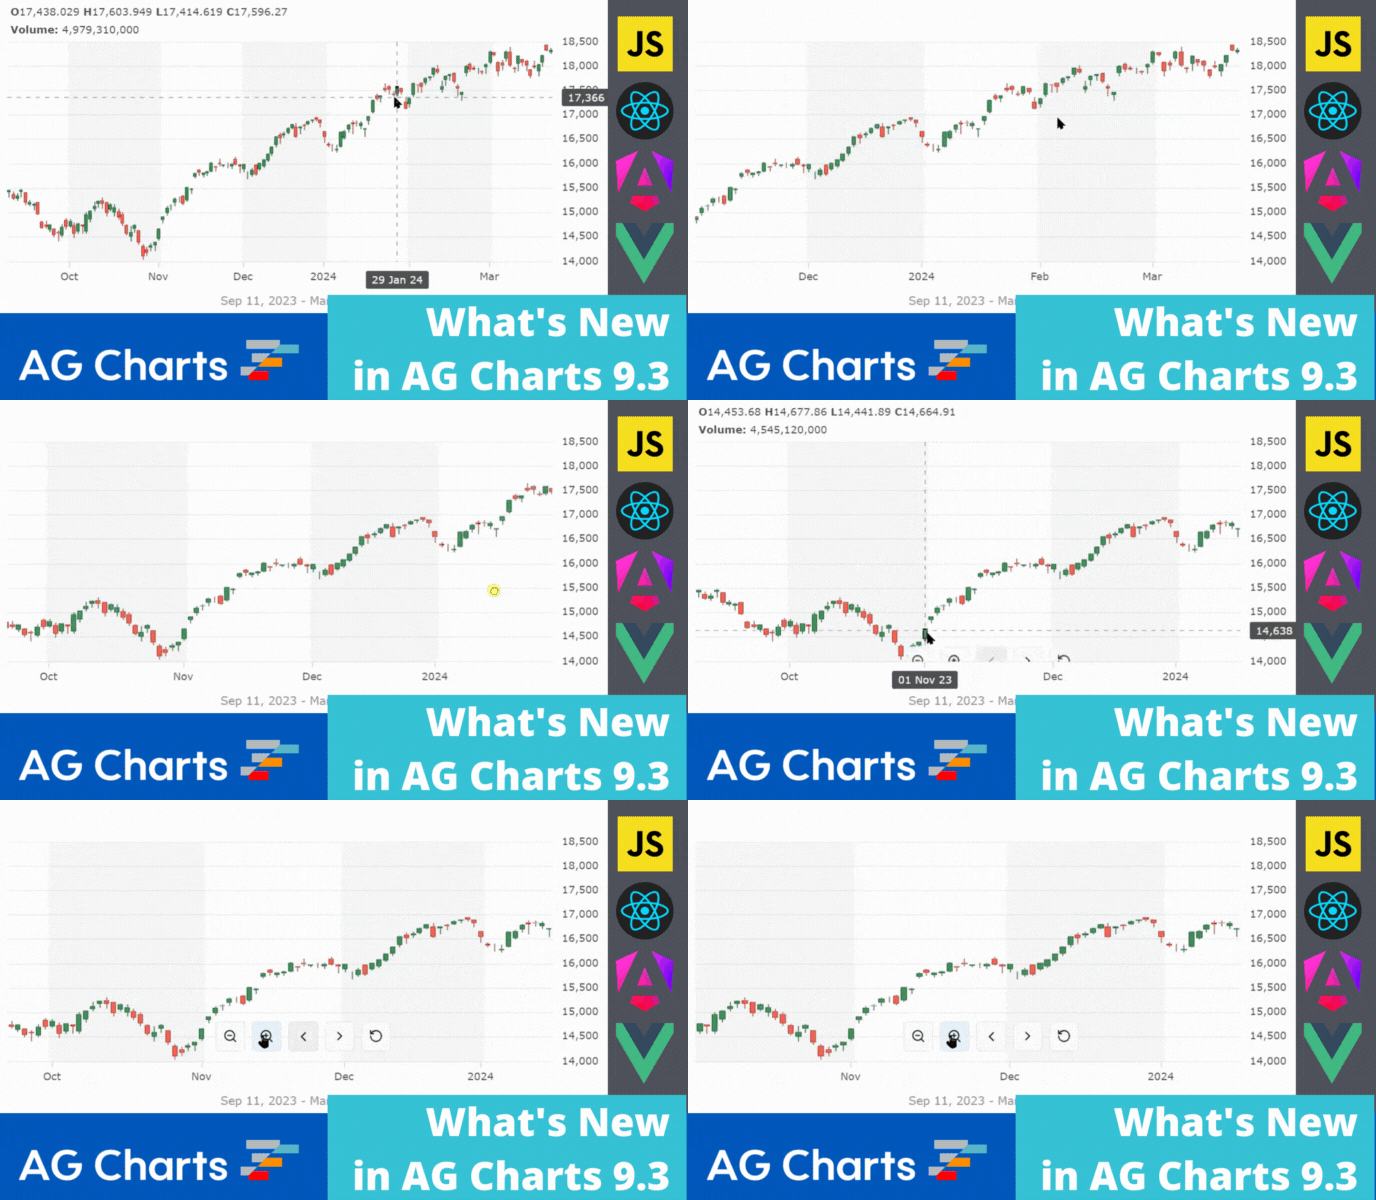
AG Charts 9.3 is an important minor release which adds accessibility support with keyboard navigation and screen reader announcements. It also includes new series and axis types as well as zoom buttons as well as improvements to stability and performance:
As this is a minor version there are no breaking changes for anyone upgrading from AG Charts 9. However, we recommend reading the migration guide and reviewing the list of changes in the release notes when planning to update to this version.
Accessibility Support
AG Charts 9.3 adds support for accessibility based on the Web Content Accessibility Guidelines (WCAG) standard.
Specifically, AG Charts provides Keyboard Navigation to focus all series and legend elements using the Tab and Arrow keys as well as using the Enter or Space keys to toggle legend items or trigger click events on chart series items.
For visually impaired users AG Charts generates announcements when a Screen Reader is used. The focused chart element is announced together with the relevant contextual information such as number of series within the chart and the title, subtitle and footer of the series.
See this documented here and illustrated below:

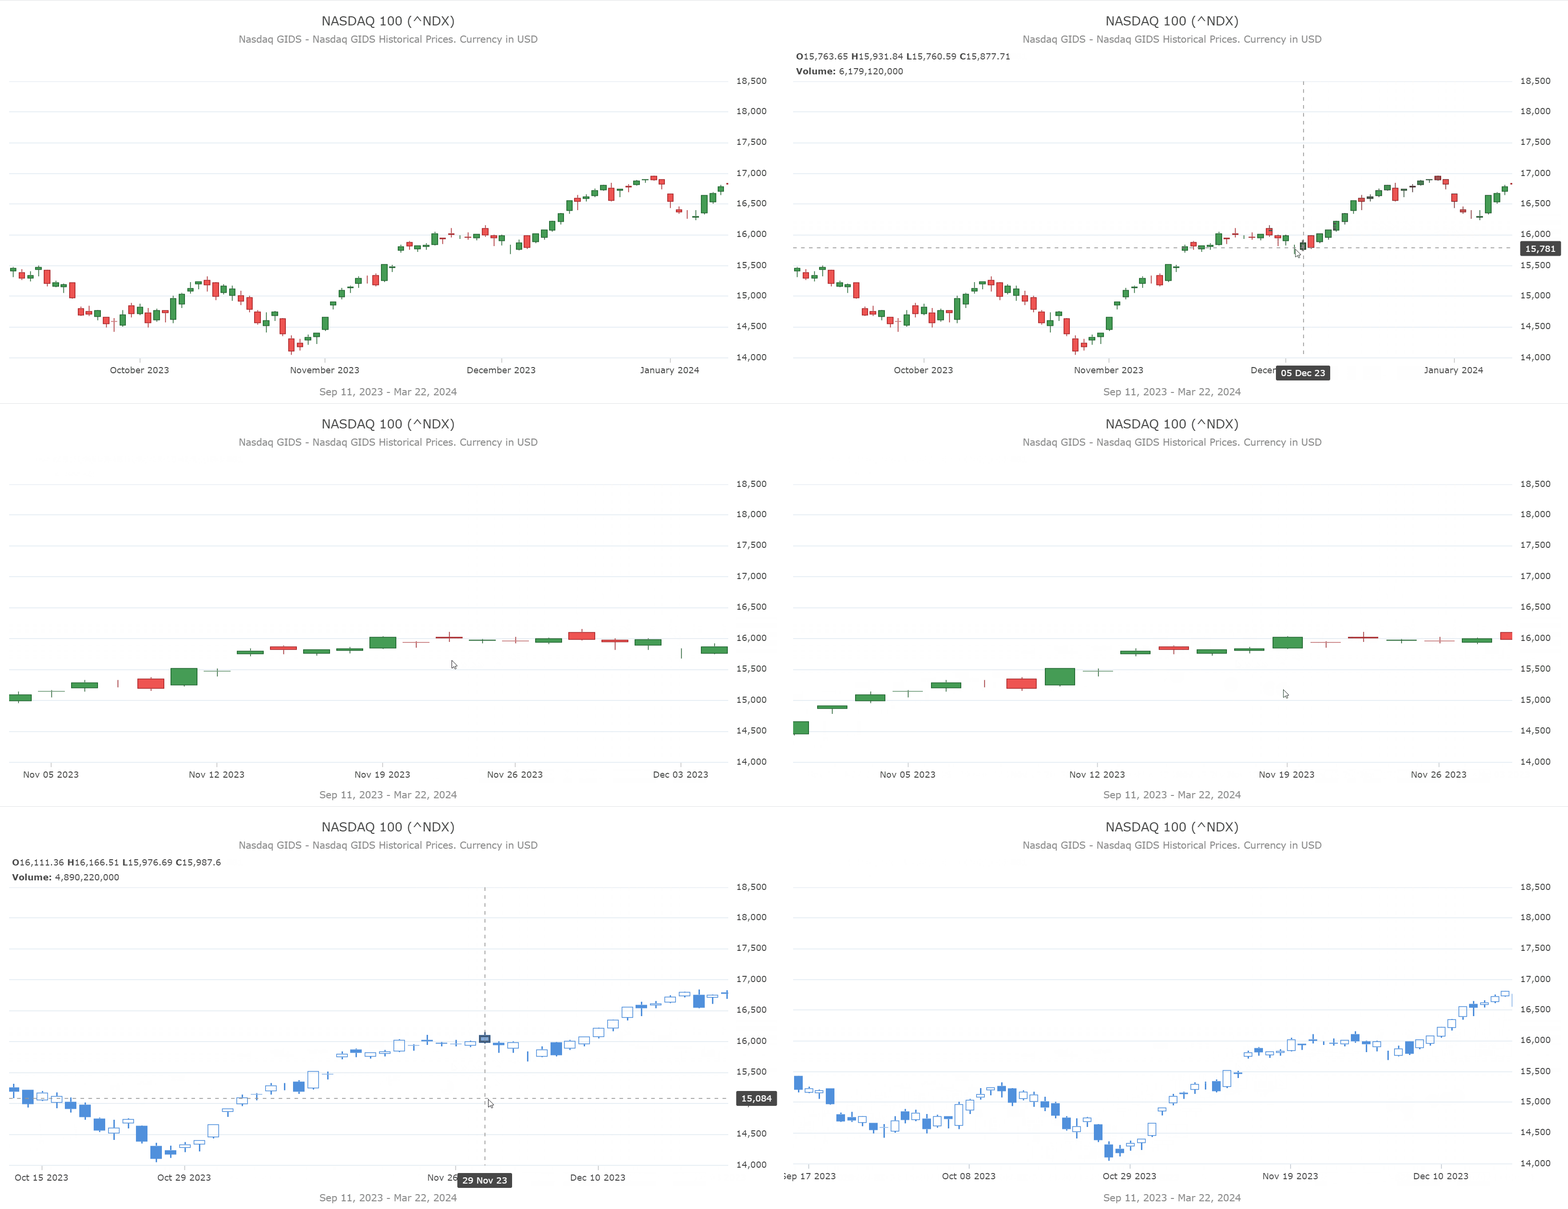
Candlestick Series Type
AG Charts 9.3 now includes a candlestick series type which shows the current data point values on the top-left of the chart. This series type is commonly used in financial applications to track stock price fluctuations. This series can be styled in a variety of ways and fully supports all the interactivity features provided by the chart - zooming, crosshairs, synchronization, etc.
See this documented here and illustrated below:
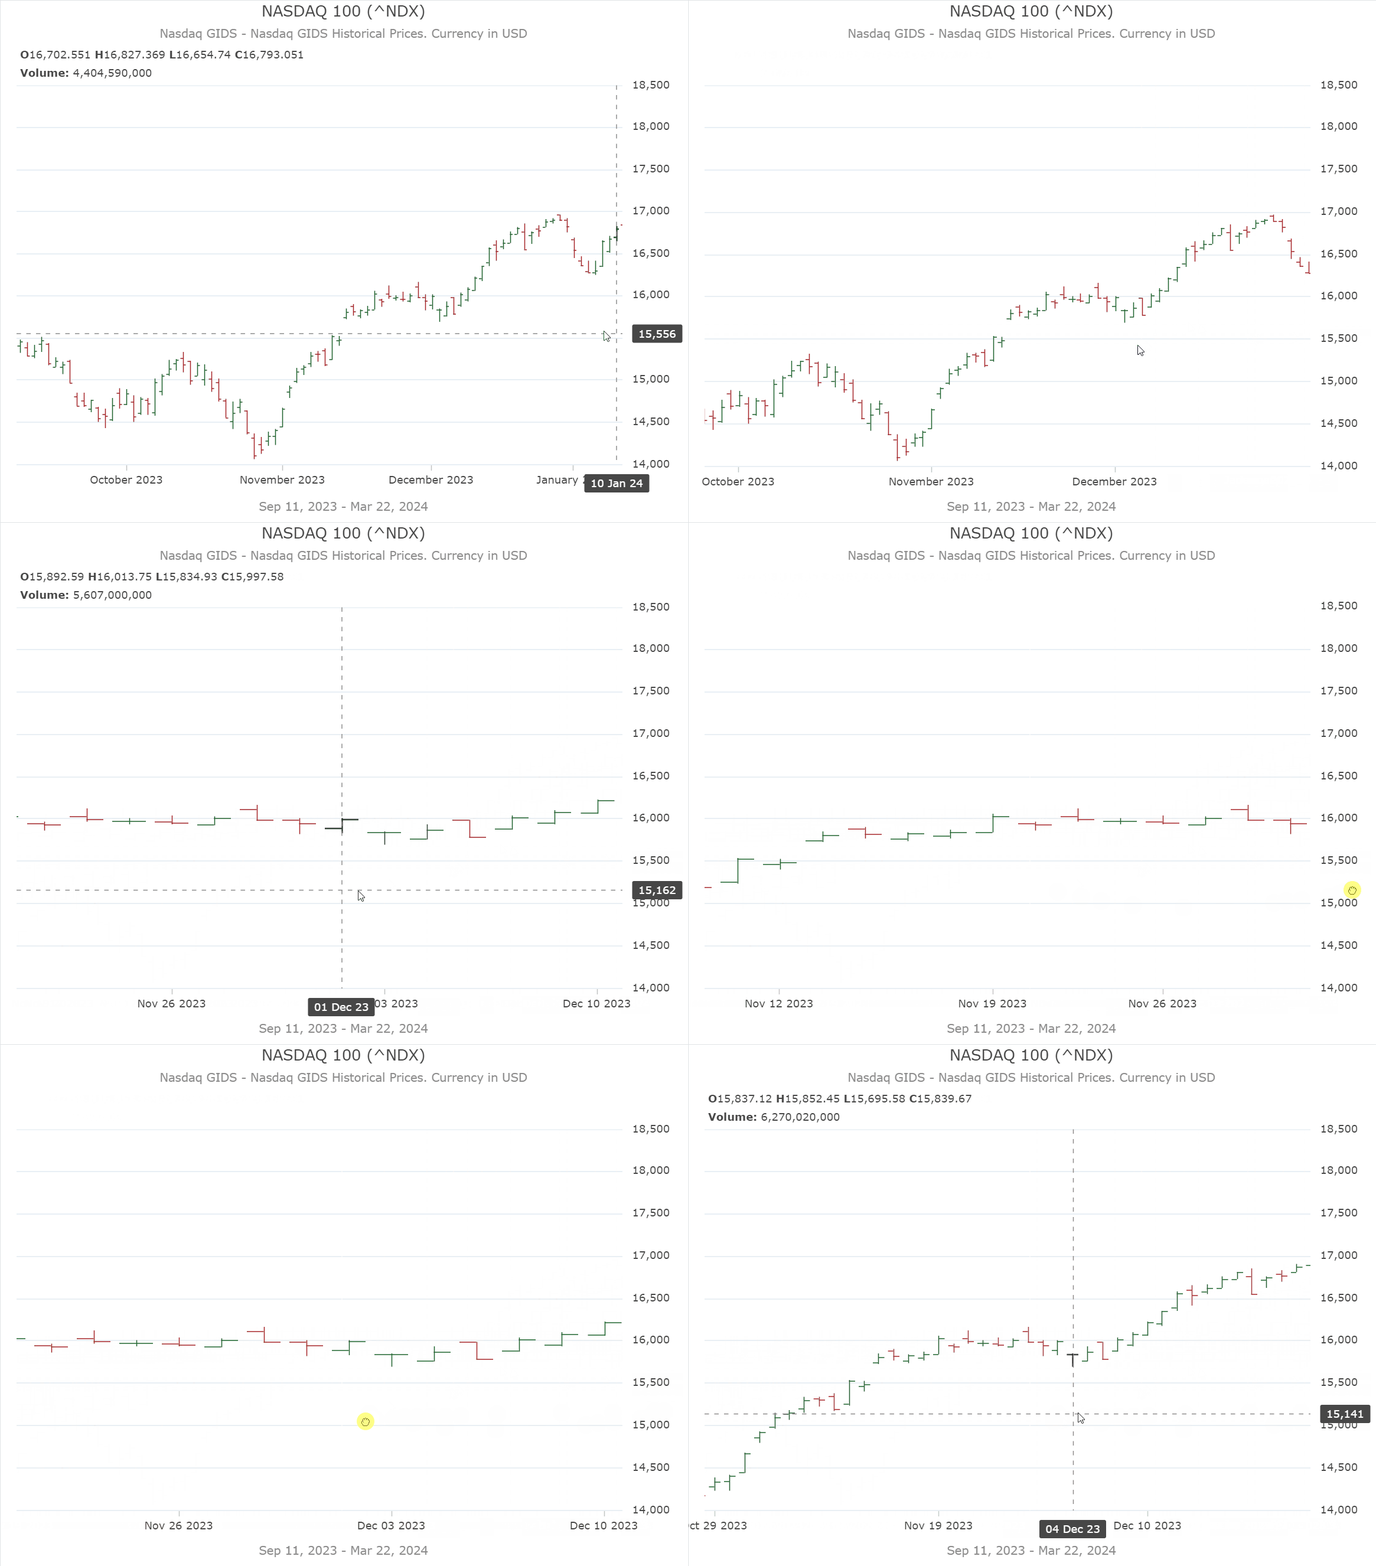
OHLC Series Type
Similar to the candlestick series type, the OHLC series type displays the same stocks type of data but using a more minimalistic representation.
See this documented here and illustrated below:
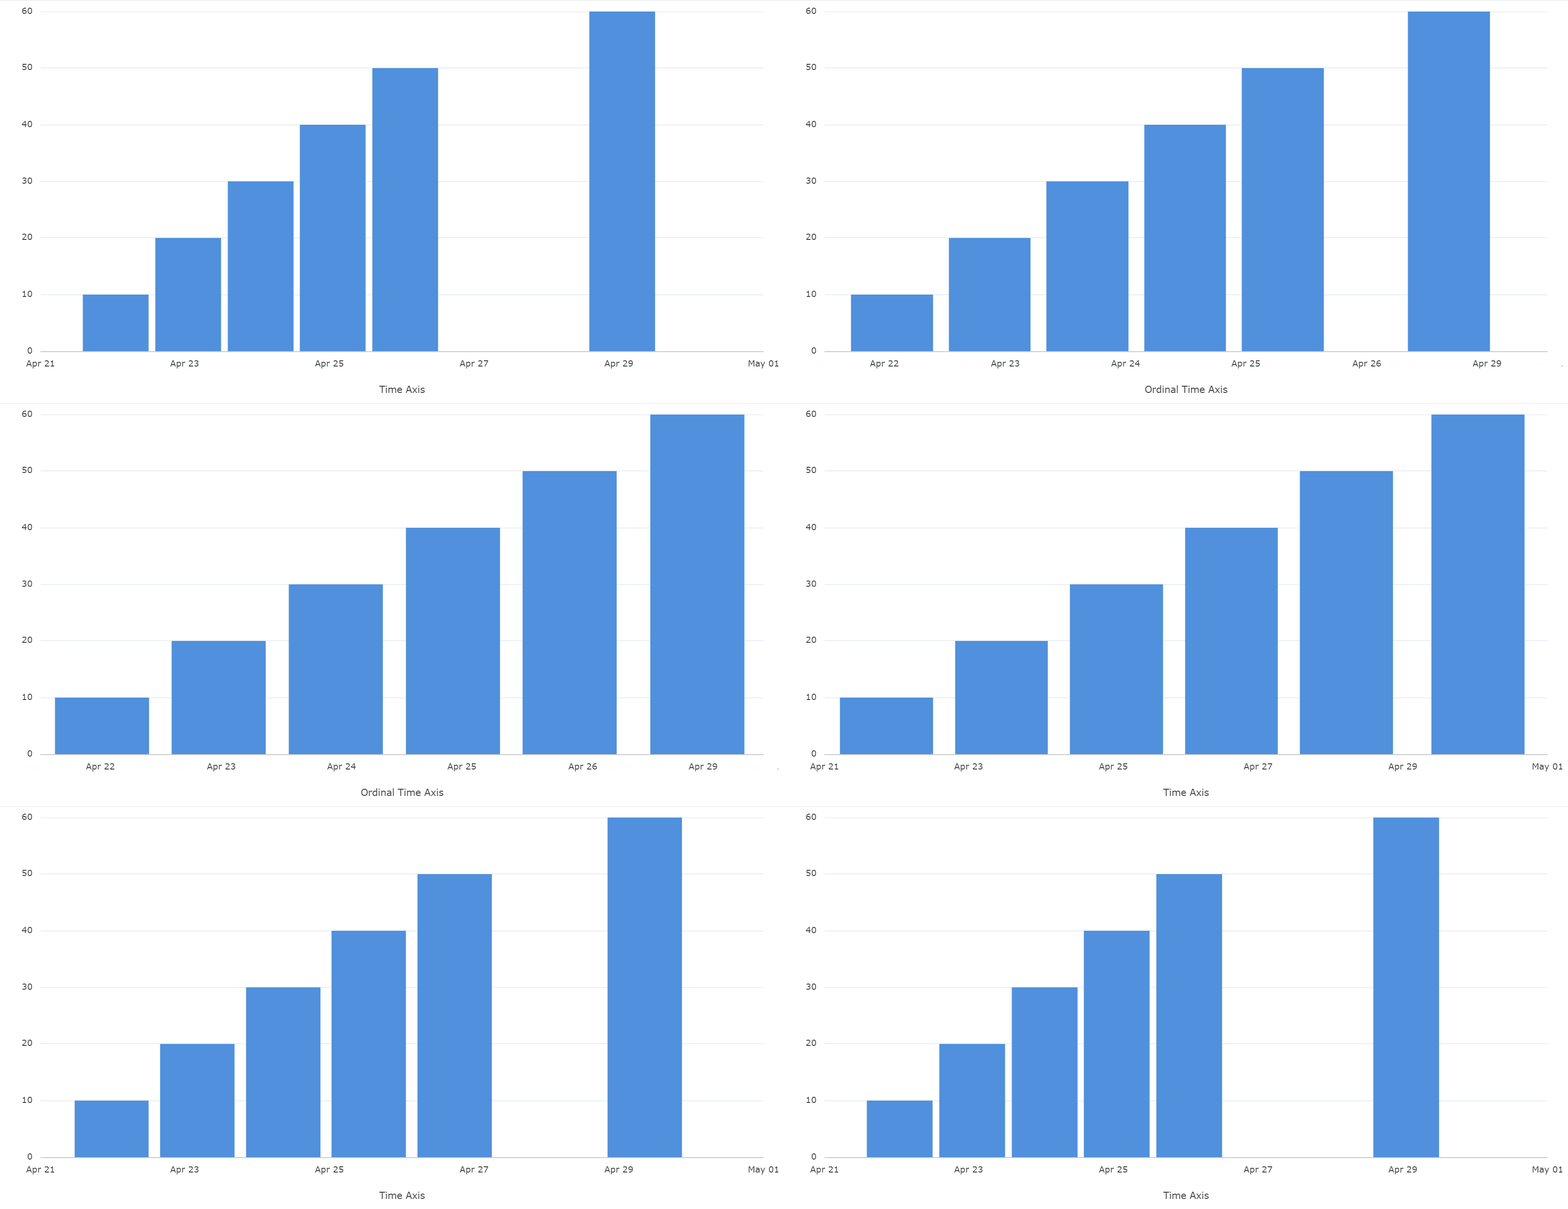
Ordinal Time Axis
Some time-based data sets have gaps, for example due to a lack of data readings on weekends. When such a dataset is plotted against a continuous time axis, there will be empty spaces in the chart series representing the data gaps.
To avoid showing these gaps in the series rendering, we have added an ordinal-time axis to AG Charts. This type of axis behaves just like a time axis but it ignores any gaps in the data, rendering a series without any blank spaces.
See this documented here and illustrated below:
Zoom Buttons
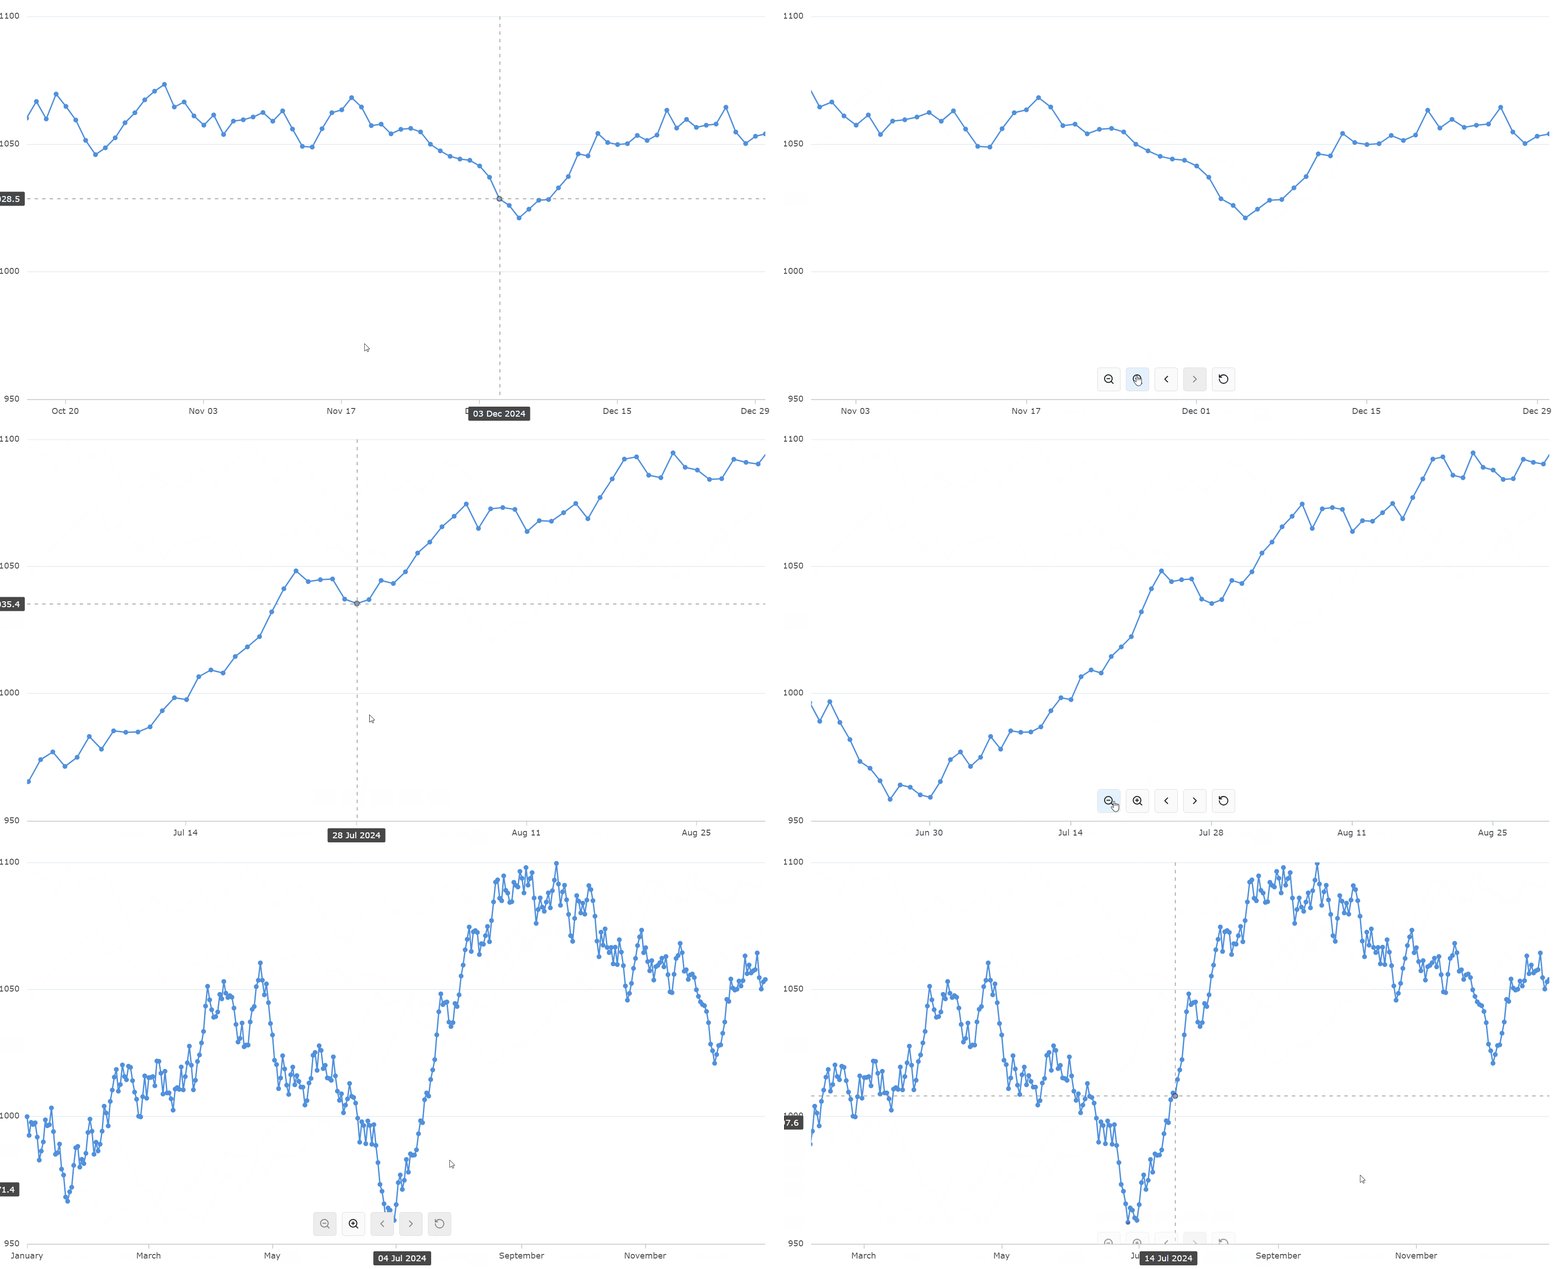
AG Charts 9.3 displays Zoom Buttons when hovering near the bottom edge of zoomable charts. These buttons are unobtrusive and let the user access the full zoom functionality, improving the user experience.
See this documented here and illustrated below:
Summary
AG Charts 9.3 is an important minor version - it adds accessibility support, new series and axis types and an improved zoom user interface. In addition, there are many enhancements to existing features as well as improvements in performance and stability.
If you're upgrading from a previous version of AG Charts, we recommend reviewing the release notes when planning to update. You can also see the full list of changes in our changelog.
As always, we’re keen to help you upgrade and to hear your feedback.
Happy coding!
