AG Grid 26.1 is a minor release with major improvements across a number of different areas. In this post, we'll highlight the major enhancements that make AG Grid 26.1 an important step forward in terms of new functionality, quality and accessibility support.
As always, you can see the full list of changes in AG Grid 26 in our changelog.
Sparklines
AG Grid 26.1 adds sparklines - compact charts displayed inside AG Grid cells. Sparklines help you visualize numeric data so your users can quickly understand the data trend or spot any irregular data.
The AG Grid sparklines support line, area and column visualizations together with different axis types to support a variety of scenarios. In addition to supporting a few different data formats, we've added interactivity features such as tooltips and points of interest which allow your users to make sense of the data.
The sparkline functionality is tightly integrated in AG Grid which makes it easy to set up and keeps scrolling responsive as you scroll through rows and columns containing sparklines, as shown below:
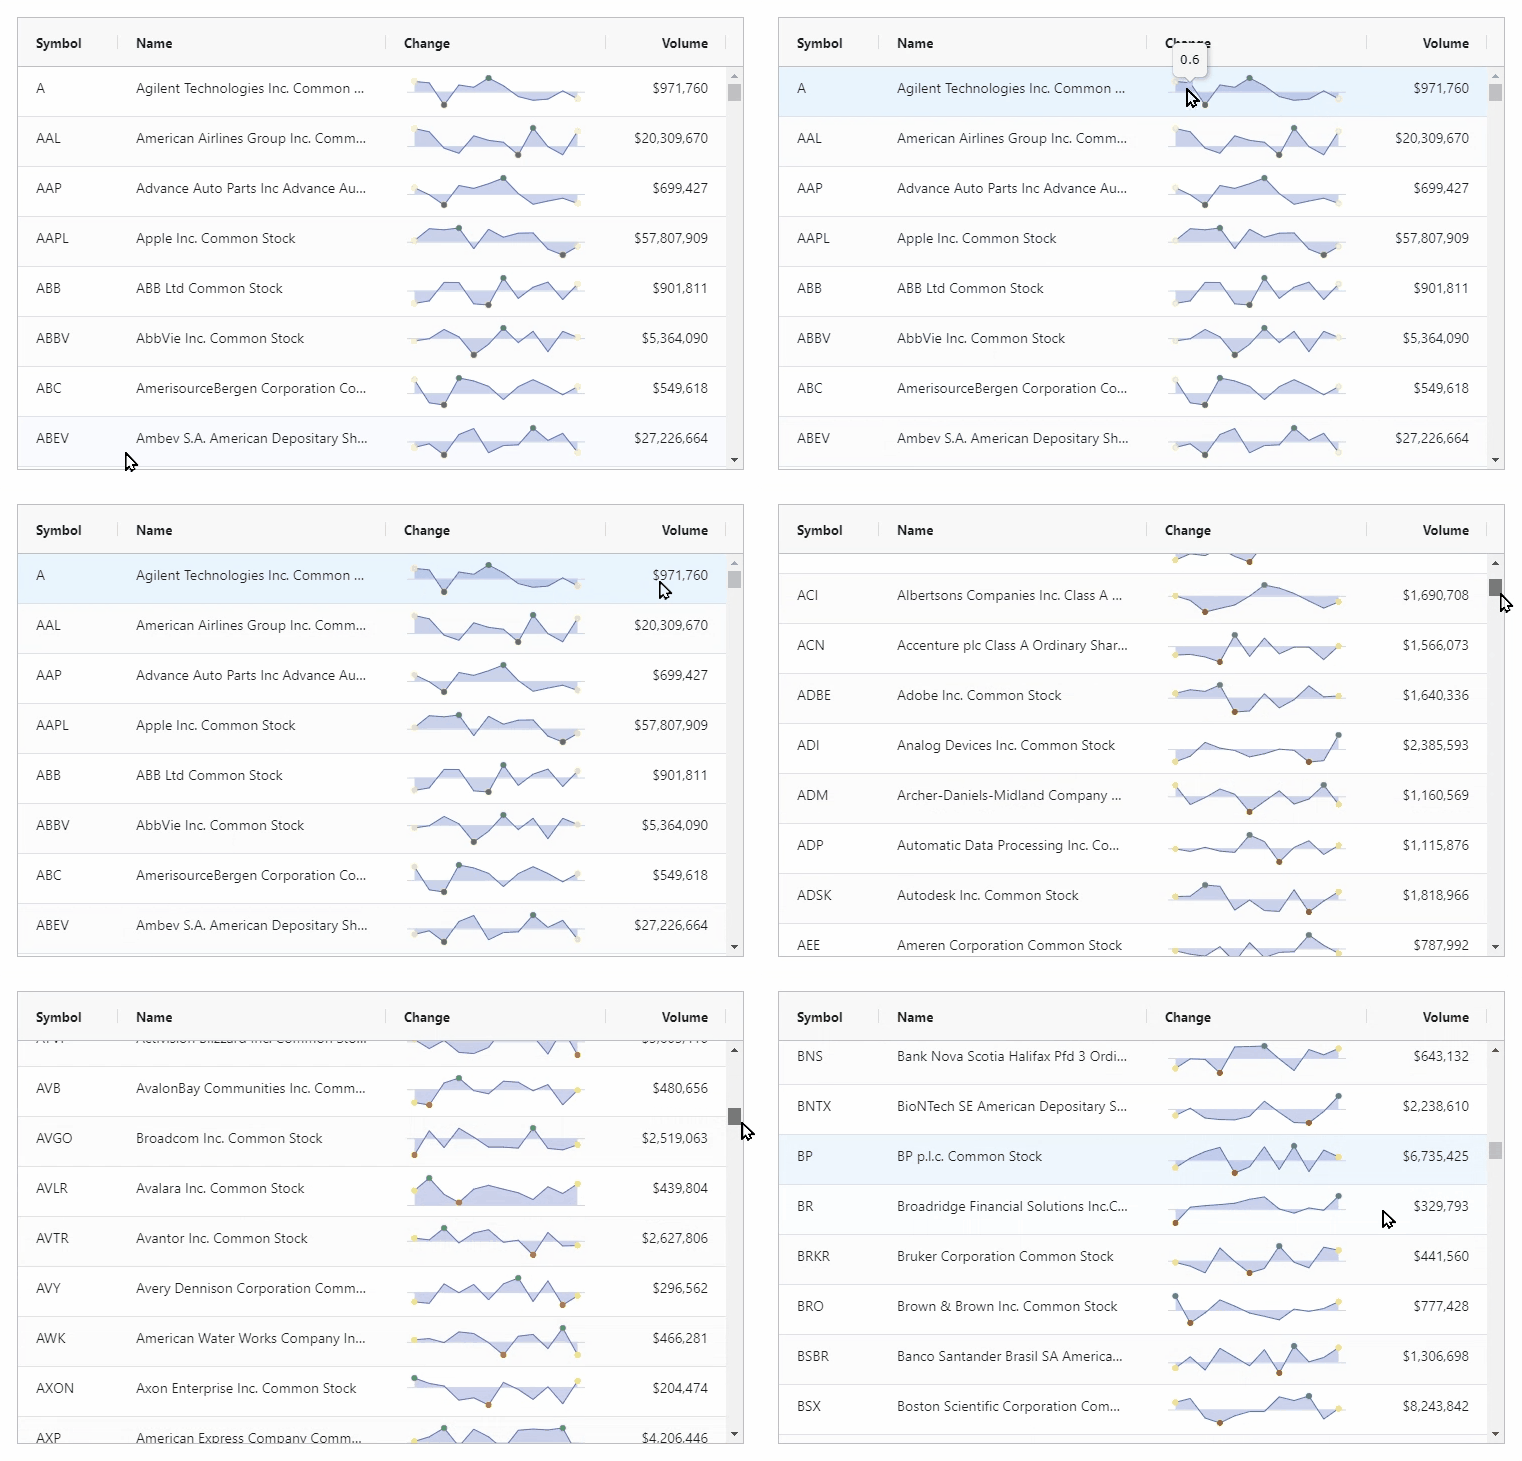
Chart Series Highlighting
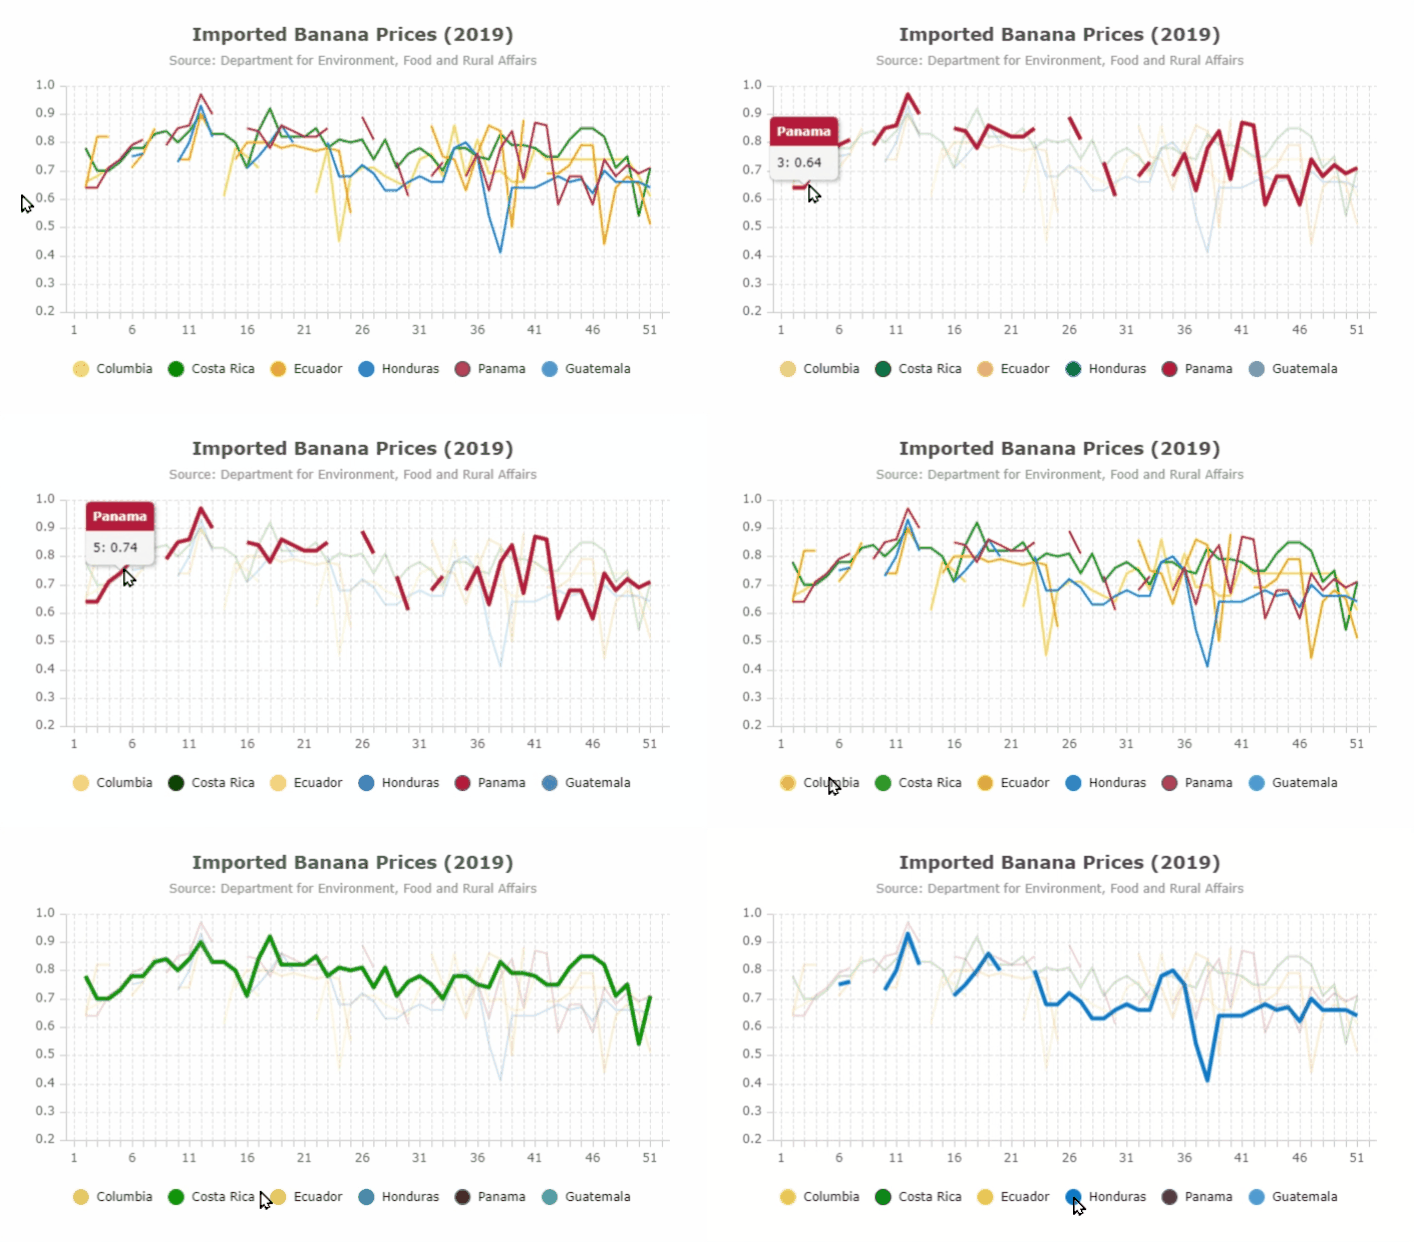
When using the standalone chart you may have multiple series which are displayed quite close together and are difficult to distinguish. In order to help you more easily tell series apart, in AG Grid 26.1, the standalone chart now offers chart series highlighting across all series types. When activated, hovering a series item will dim other series items, allowing you to clearly see the items of the hovered series, as shown below:
AG Grid ReactUI supports React column header components
In AG Grid 26, we added a new rendering engine written purely for React called ReactUI. In this version, we've enhanced this further by adding support for React-based column header components when using ReactUI.
This means that if you couldn't use ReactUI before because you were using custom React column header components, you can now fully take advantage of the improved rendering performance and simplified component code that React UI delivers.
Drag and Drop to reorder columns in the columns tool panel
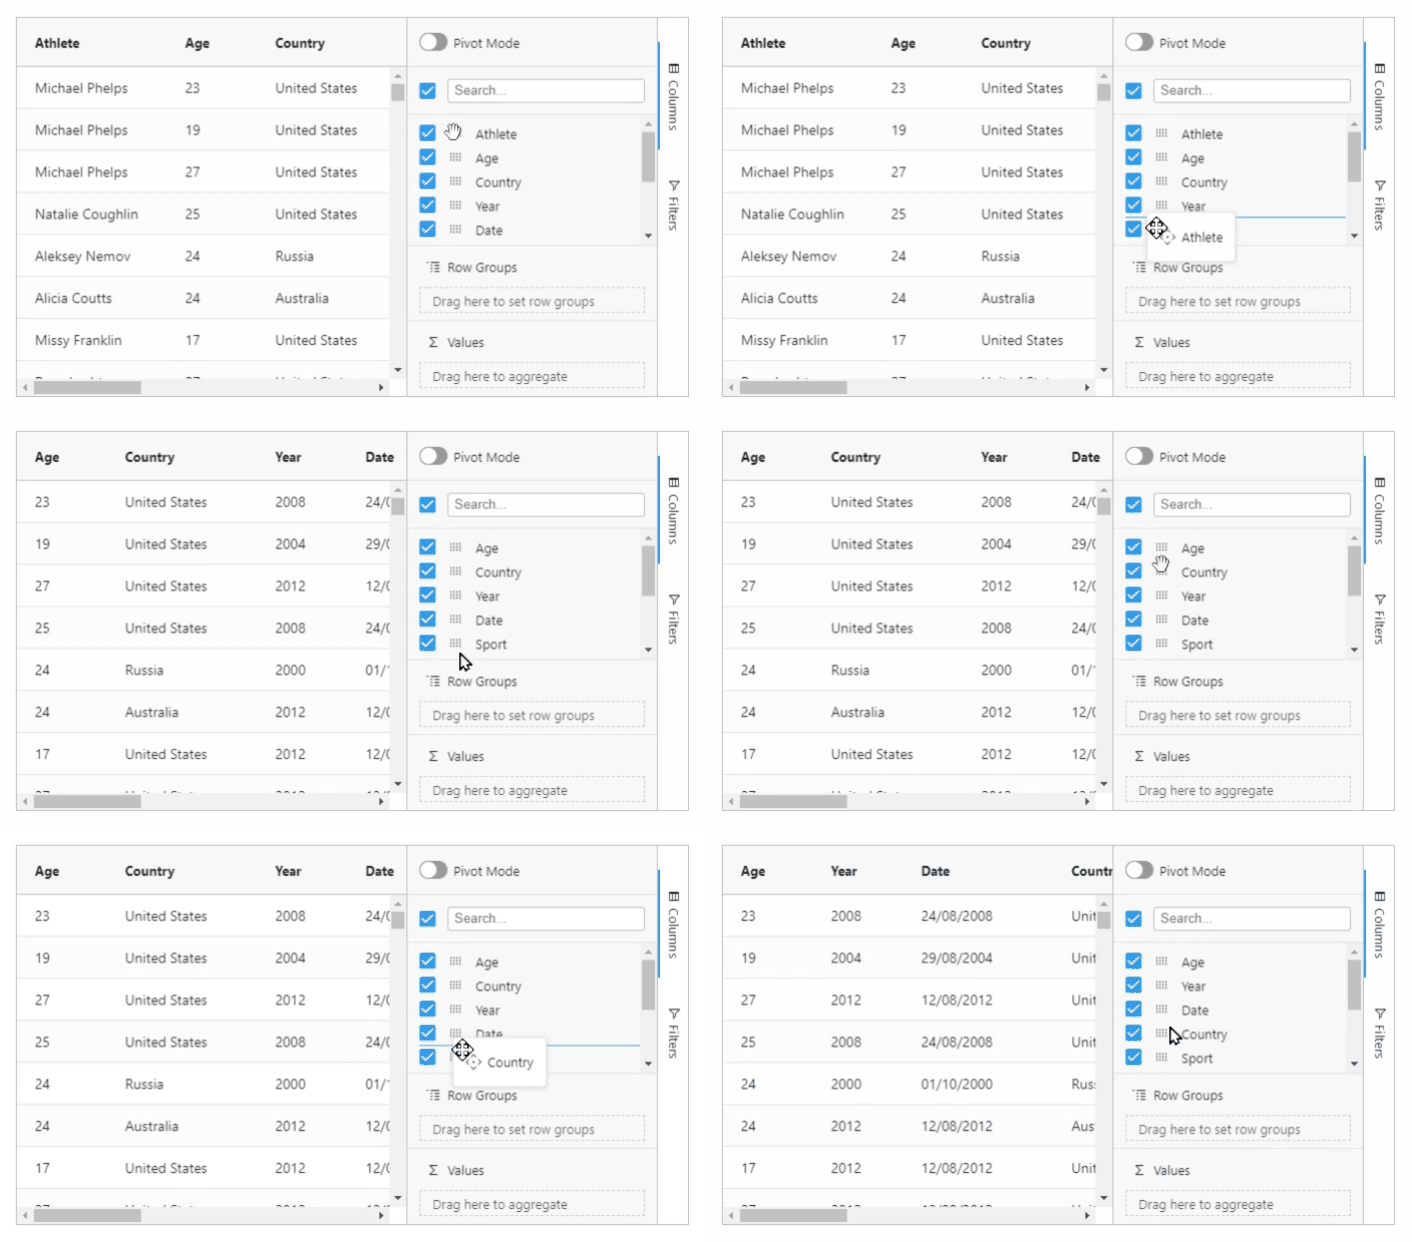
Users can now drag and drop items in the columns tool panel to reorder the columns in the grid as standard functionality. This is especially useful when you have a long list of columns and dragging columns across the grid isn't practical. See this demonstrated below:
Entire Row Dragging
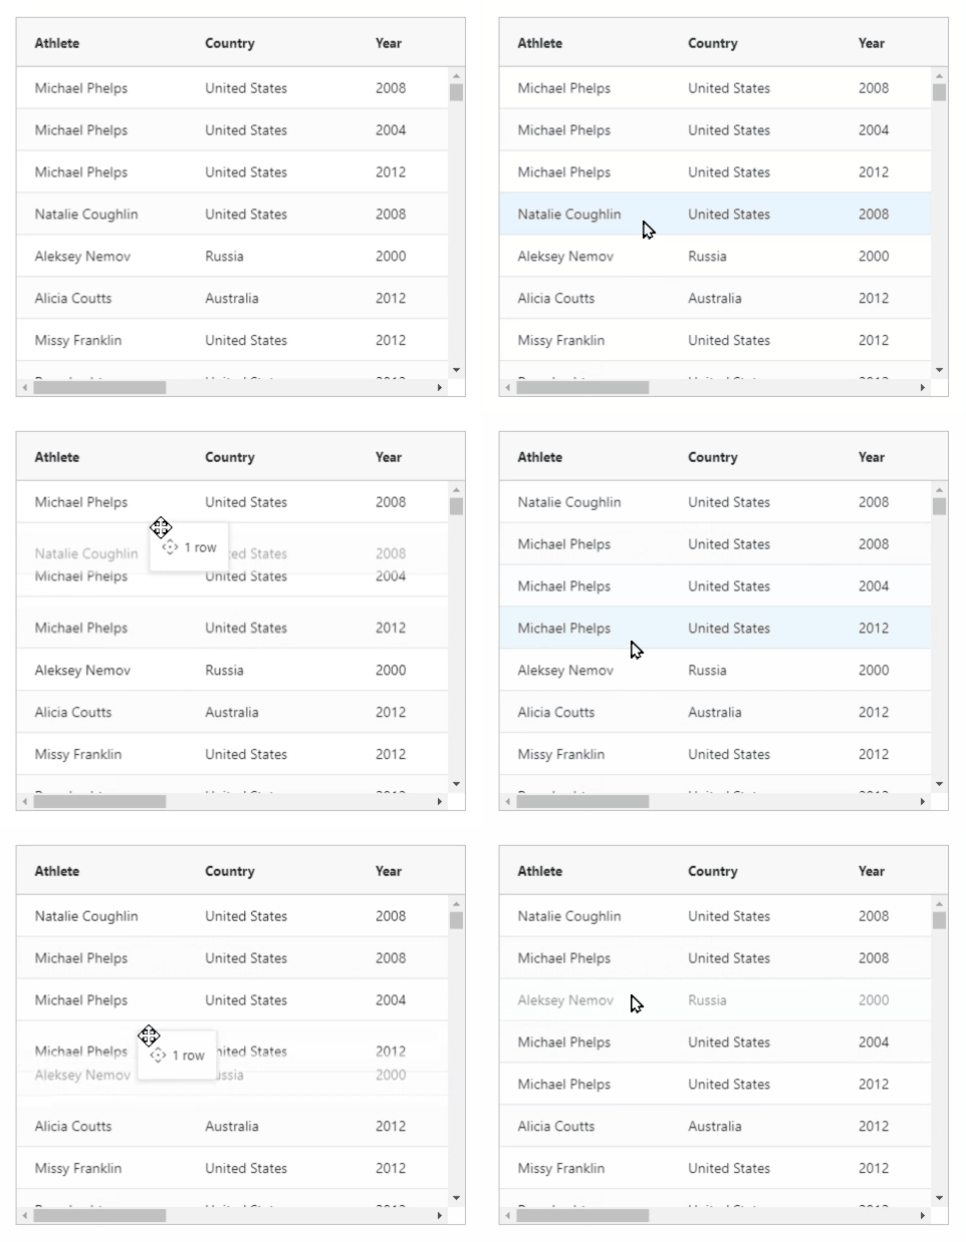
When using row dragging, you can now start a row drag from anywhere inside the row, instead of only using the row drag element. Entire row dragging can help your users interact with grid rows in a more fluid fashion, as illustrated below:
Accessibility
AG Grid 26.1 adds significant improvements in accessibility support, further enhancing compliance with the WCAG standard. These updates enable screen readers to better announce items in the columns and filtering tool panels as well as the number of selected or filtered rows.
Updated API Documentation
AG Grid 26.1 significantly improves the developer experience by making all the API typing information listed across our documentation pages dynamically generated based on the AG Grid source code. This way all the typing information for parameters and return types will always be accurate and available in an easy to use format. This means you can quickly look up any API member and avoid typing issues in your code when using AG Grid.
Summary
The list above includes the major improvements in AG Grid 26.1. We recommend planning to upgrade to this new version soon, so you can deliver these important improvements to your end users and benefit from the updated API documentation.
As always, we’re keen to help you upgrade and to hear your feedback.
Happy coding!
