

AG Charts 13.1 improves how large categorical datasets are visualised, introducing new options for bar width control and built-in scrollbars for navigating dense charts. This release also expands the State API, making it easier to respond to and replicate user interaction:
Key Features
- Series Bar Width Customisation - A range of new options for customising and working with variable-width bars.
- Actual vs Target Bars - Visualise progress by comparing actual values against target benchmarks within bar charts.
- Scrollbars - New scrollbar feature for exploring large categorical datasets without compromising on readability.
- Active Item State - Expanded State API to include the currently active item to make responding to user events even easier.
Series Bar Width Customisation
AG Charts 13.1 introduces several new ways to configure and manage bar widths in your charts, allowing you to standardise the visuals across varying dataset sizes, making comparisons more intuitive.
Fixed Width Bars
The first new option allows you to apply fixed-widths (defined in px) to bars within your chart - make bars smaller to increase the data within the current view, or make them larger and allow users to navigate the dataset with the new Scrollbar feature:
To define a fixed width, supply a px value to the series.width property:
const series = [
  {
    type: 'bar',
    width: 30, // Fixed bar width in px
  }
]
Width Ratio Bars
You can also define bar width as a ratio of its default size, which can be particularly useful when performing comparisons across datasets:
Bar width ratios can be configured with the series.widthRatio option:
const series = [
  {
    type: 'bar',
    widthRatio: 0.4, // Relative to default size
  }
];
The width and widthRatio options can be used on Bar, Box Plot, Range Bar and Waterfall series.
Band Alignment
In addition to configuring bar width, you can now control how bars are aligned.
Bars can be justified across the entire chart, or aligned to the start, centre, or end of the axis. This ensures your charts look exactly as intended, regardless of dataset size or bar width.
To configure how bars are aligned within the chart, set the value of bandAlignment axes option on a Category, Ordinal Time, or Unit Time axis to one of start, centre, end, or justified:
{
  axes: {
    x: {
      type: 'category',
      bandAlignment: 'start', // or 'center', 'end', 'justified'
    },
  },
}
Example: Actual vs Target Bars
Enabled by the new bar widths features, you can now create charts that display actual vs target bars to easily visualise progress against goals:
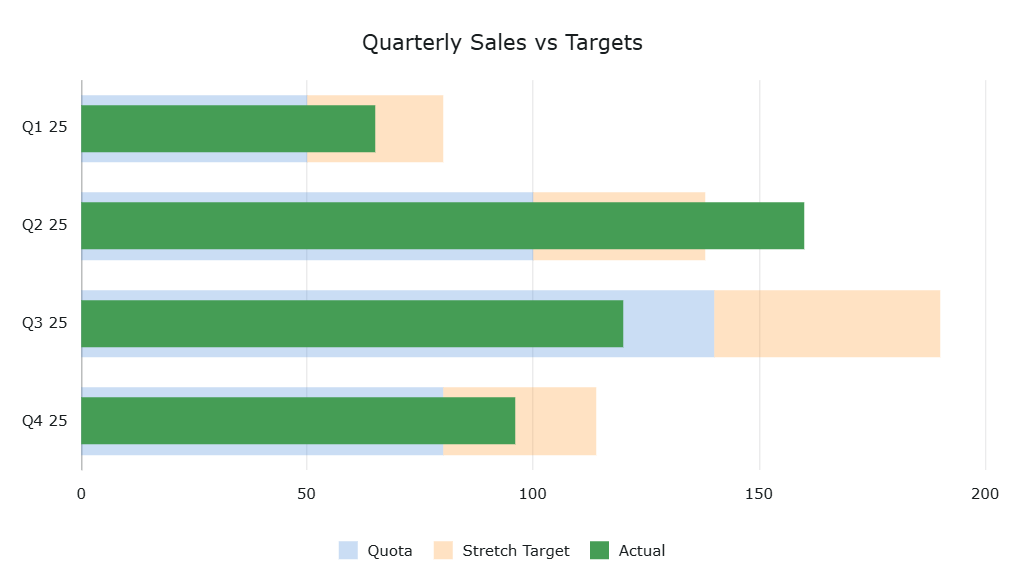
In the example above, the series are ungrouped and therefore appear overlaid. The "Actual" series has a width ratio of 0.7, whilst the "Satisfactory" and "Excellent" target series are stacked and have a width ratio of 1:
series: [
  {
    type: "bar",
    direction: 'horizontal'
    xKey: "quarter",
    yKey: "quota",
    fillOpacity: 0.3,
    stacked: true,
    grouped: false,
  },
  {
    type: "bar",
    direction: 'horizontal'
    xKey: "quarter",
    yKey: "stretch",
    fillOpacity: 0.3,
    stacked: true,
    grouped: false,
  },
  {
    type: "bar",
    direction: 'horizontal'
    xKey: "quarter",
    yKey: "actual",
    grouped: false,
    widthRatio: 0.7,
  },
],
See the Series Bars docs for full configuration options.
Scrollbars
Scrollbars have been introduced in AG Charts 13.1. These provide built-in horizontal and vertical scrolling for charts, allowing users to explore large datasets without reducing chart size or readability:
To enable scrollbars, set the scrollbar.enabled option to true:
{
  scrollbar: {
    enabled: true,
  },
}
When enabled, scrollbars appear in any direction that is scrollable based on the current data window, though this can be configured via the scrollbar chart option. This option allows customising position and styling for all scrollbars, and horizontal and vertical scrollbars can be overridden with the scrollbar.horizontal and scrollbar.vertical properties, respectively.
See the scrollbar documentation for configuration details and advanced behaviour.
Active Item State and Event
AG Charts 13.1 extends the State API to include an active state property that exposes the currently active chart element (such as a bar or legend item), making responding to user inputs even easier - listen for activeChange events, get the current active item from the state object, and apply intelligent actions based on user interactions:
You can access the currently active element by calling getState() on a reference to your chart, which will include the active element, e.g:
console.log(chartRef.getState());Would print:
{
  active: {
    activeItem: {
      itemId: 4,
      seriesId: "BarSeries-#", // or pre-configured series id
      type: "series-node" // or legend-item, etc..
  }
  // ...other state properties
}
Refer to the State API docs for more information.
Summary
AG Charts 13.1 focuses on improving the visualisation of large categorical datasets, providing greater control over bar presentation, navigation, and user interaction. This release:
- Introduces fixed and ratio-based bar-width configurations for precise control over visual density and emphasis.
- Enables common visual patterns such as Actual vs. Target bars through expanded bar width and grouping options.
- Adds built-in horizontal and vertical scrollbars to enable smooth navigation of large datasets without compromising readability.
- Expands the State API to expose the currently active chart item, simplifying responses to user interactions and providing programmatic control over it.
As always, we welcome feedback. Enterprise customers can contact us via Zendesk; Alternatively, please submit a GitHub issue or complete our contact form.
Next steps
New to AG Charts? Get started in minutes, for free, with your favourite framework:
Considering AG Grid Enterprise? Request a free 30-day trial licence to test your application in production and get direct access to our support team.
Happy coding!