
Version 12.3 of AG Charts, our JavaScript Charting Library, adds enhanced layout control, improved styling capabilities along with many smaller feature enhancements and stability improvements.
The key features from this release include:
- Axis Crossing Point - Control where cartesian axes cross each other.
- Sankey Layout Options - Extra layout options and improved algorithm for Sankey series for cleaner appearance.
-
Difference Area Chart - Additional
invertedStyleand high and low differentiation extend the Range Area chart. - Multi-Style Labels - Multiple font styles within series and axis labels.
Axis Crossing Point
Axes now have a crossAt property to control the specific value at which perpendicular axes intersect.
This provides greater control over the chart's origin, which is useful for creating charts with negative values or for analyses where data needs to be compared against a specific baseline other than zero.
const options = {
    // ... other options
    axes: [
            {
                type: 'number',
                position: 'left',
                // place the left axis at '0' on the bottom axis scale
                crossAt: { value: 0 },
            },
            {
                type: 'number',
                position: 'bottom',
                // place the bottom axis at '0' on the left axis scale
                crossAt: { value: 0 },
            },
        ],
};
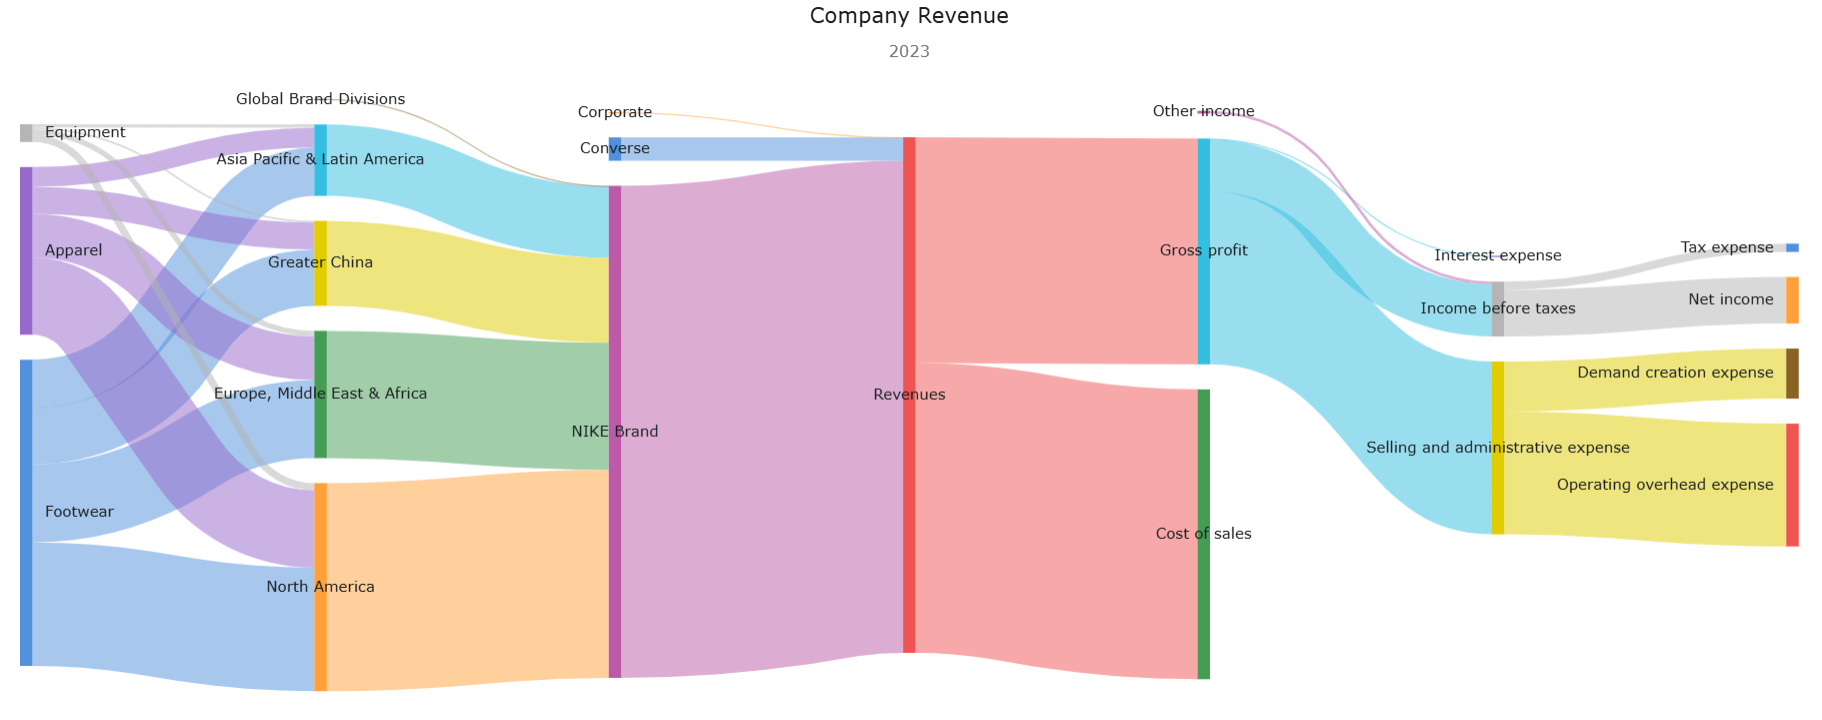
Sankey Layout Options
This release introduces an improved default layout for Sankey diagrams that optimizes space usage, reduces overlaps and adapts better to smaller chart sizes.
New layout options provide greater control over node positioning and label placement, enhancing clarity and readability. The new sort option allows sorting by data order or alphabetically, while the auto sort option automatically improves layout efficiency and reduces overlapping links.
const options = {
    // ... other options
    series: [
        {
            type: 'sankey',
            // ... data keys
            node: {
                alignment: 'justify',
                verticalAlignment: 'top',
                sort: 'auto',
                node: {minSpacing: 10},
            },
        },
    ],
};
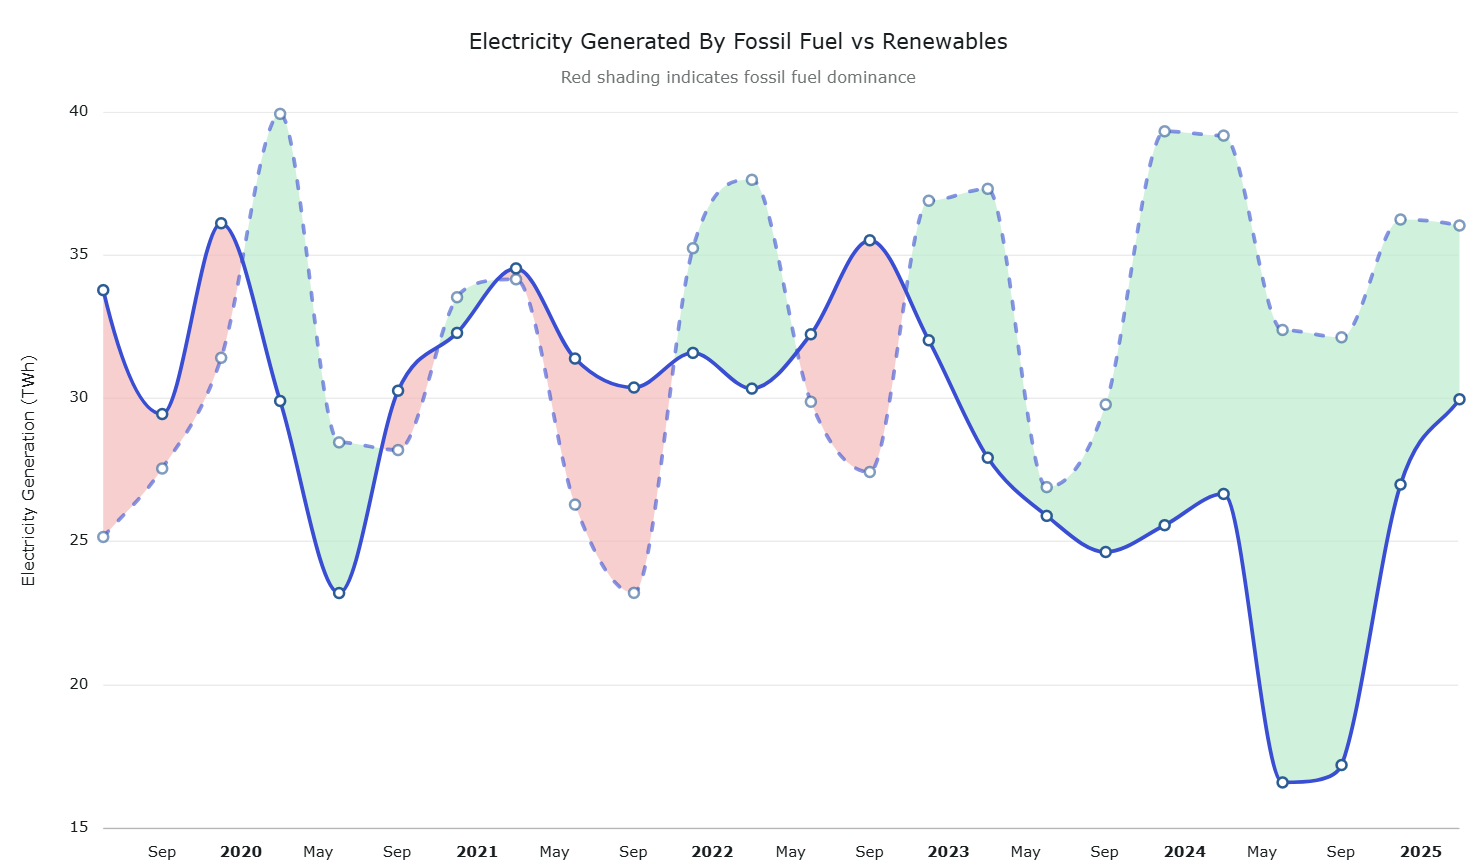
Difference Area Chart
New style options on the range-area series allow creating a Difference Area Chart as well as greater customisation of low and high values.
Negative ranges can be styled using the invertedStyle option. The high and low styling options improve clarity when lines frequently cross.
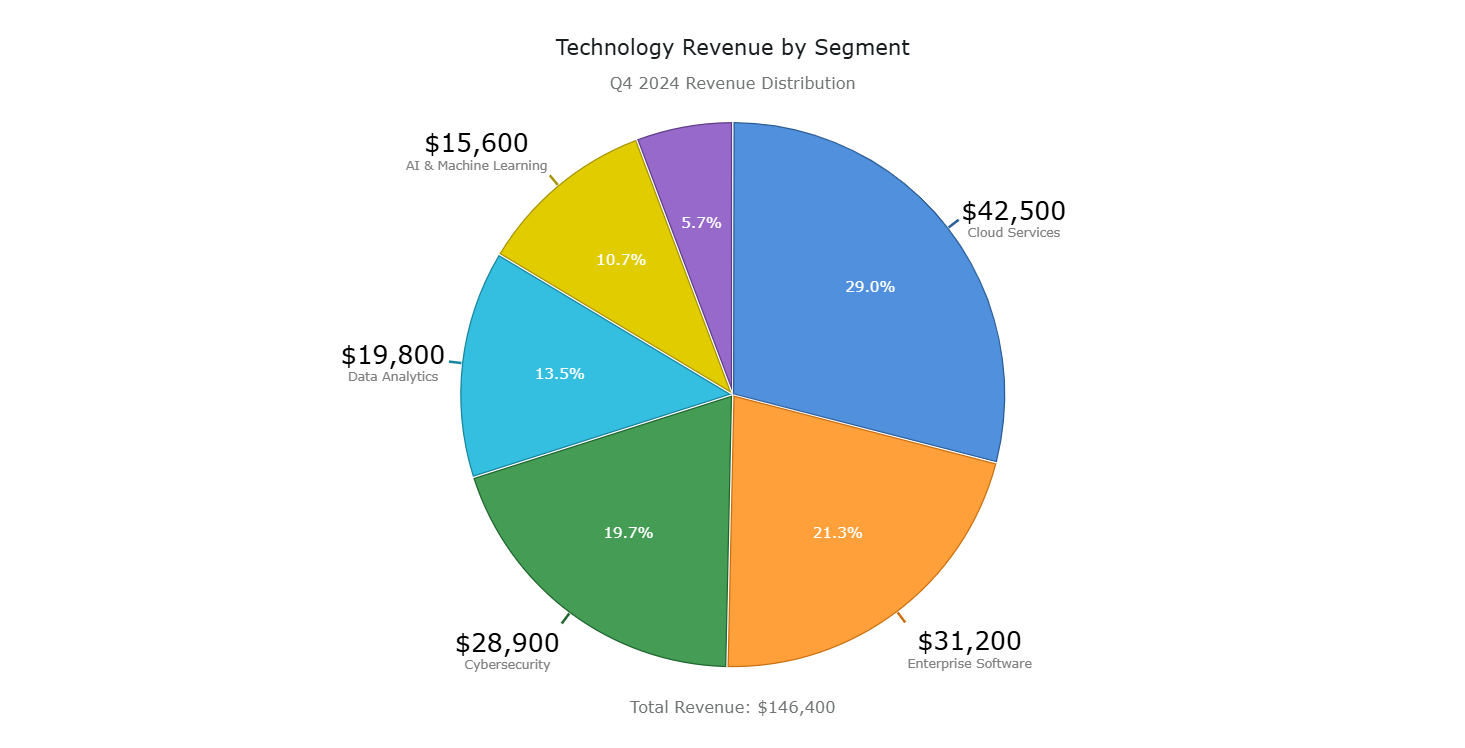
Multi-Style Labels
Label formatters now support multi-style text. By returning an array of text objects from a formatter, you can apply different font sizes, weights, and colors to different parts of a single label.
This allows for the creation of more informative and visually rich labels that can emphasize key values or add secondary information.
const options = {
    // ... other options
    series: [
        {
            type: 'pie',
            // ... data keys
            calloutLabel: {
                formatter: ({ datum }) => {
                    return [
                        {
                            text: datum.value.toString(),
                            fontSize: 20,
                            fontWeight: 'bold',
                        },
                        {
                            text: datum.label,
                            fontSize: 12,
                            color: 'gray',
                        },
                    ];
                },
            },
        },
    ],
};
Summary
AG Charts 12.3 continues to enhance developer and end-user experience through deeper and broader styling and layout controls along with many smaller feature enhancements and stability improvements.
As always, we're here to help you upgrade, and we're keen to hear your feedback. Enterprise customers can contact us via Zendesk; Alternatively, please submit a GitHub issue.
Next Steps
New to AG Charts? Get started in minutes, for free:
Considering AG Charts Enterprise? Request a free two-week trial licence to test your application in production and get direct access to our support team.
Happy coding!