

Version 12.2 of AG Charts, our JavaScript Charting Library, focuses on improving how users read, interpret, and explore data - with finer control over label and series styling, automatic axis detection, and smooth interactivity with very large datasets (1M+ points).
The key features from this release include:
-
Label Item Stylers - Apply custom styles to specific labels with an
itemStylercallback. -
Series Stylers - A new
stylercallback function for applying styles to a whole series, based on their values. - Style Segments - Customise the style of a series for defined ranges along an axis.
- Axis Type Detection - Automatic inference of Axis type (e.g. Category, Time, Number) from the data and series type used in the chart.
- Large Dataset Interactivity - Support for large data sets whilst maintaining full, smooth interactivity.
Label Item Stylers
Series and Axis labels can now be styled and customised on a per label basis.
The itemStyler callback can now be used within label options to define custom styles for various labels:
series: [{
  label: {
    // Customise series label styles, based on arbitrary values:
    itemStyler: (p) => {
      return { fontSize: p.datum.xValue > p.datum.yValue ? 12 : 8 },
    },
  },
}],
axes: [{
  label: {
    // Customise axes label styles, based on arbitrary values:
    itemStyler: (p) => {
      return { color: p.datum.month !== 'Jul' ? 'transparent' : undefined };
    },
  },
}]
Custom label styles can be used to provide users with more readable labels that highlight important values, while reducing visual noise:
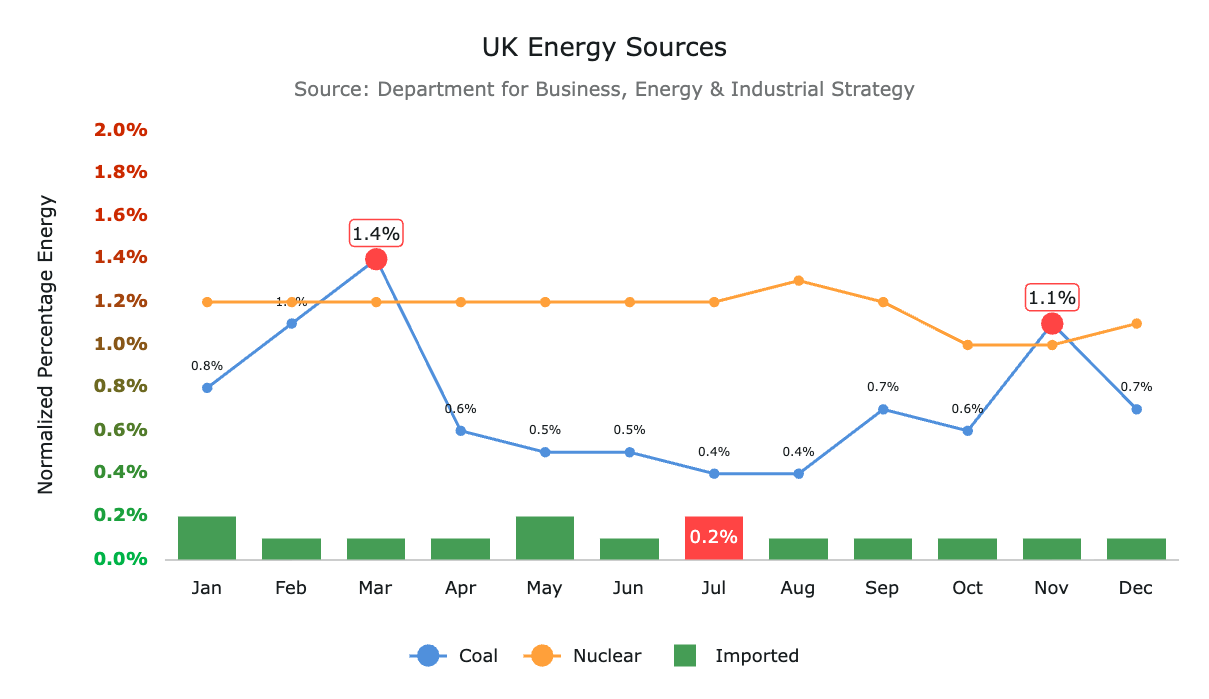
Series Stylers
All series types now include an additional callback property that gives you control of the top level style options for the entire series.
The new top-level styler callback can be used within the Theme Overrides to define properties such as fill and stroke for the entire series, and can also be used with Integrated Charts in AG Grid:
theme: {
  overrides: {
    bar: {
      series: {
        styler: (p) => {
          return {
            fill: p.yKey.includes("benchmark") ? 'grey' : 'blue'
          },
        },
      },
    },
  },
},
Applying styles consistently based on the series keys, makes it easier for users to distinguish categories, benchmarks, or trends at a glance.
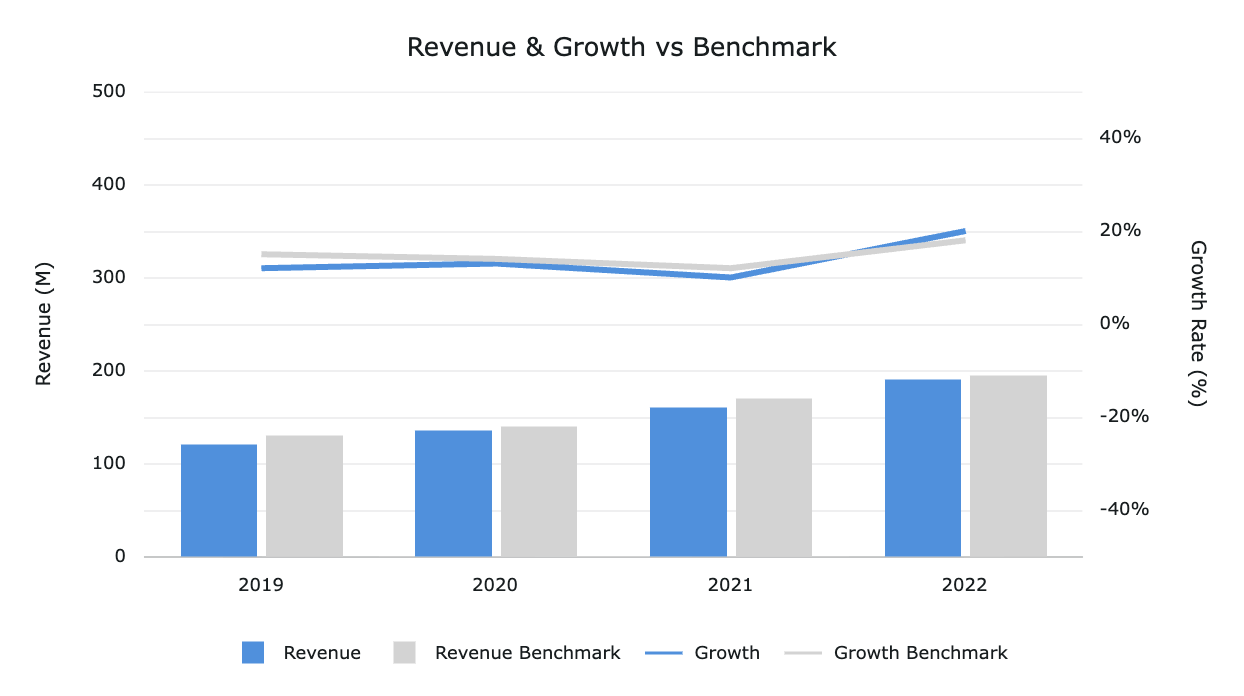
Style Segments
Style Segments allow customising the style of a series for defined ranges along an axis.
The segmentation option takes a key to determine which axis to use, and a segments array for the styles to be applied based on a stop value.
series: [{
  segmentation: {
    key: 'y', //segment along the y-axis
    segments: [{
      stop: 0, // domain minimum until 0
      fill: 'red', // used for this segment
      stroke: 'red', // used for this segment
    }],
  },
}];
Segmented styling draws attention to thresholds or value ranges, helping users quickly identify critical regions such as targets, warnings, or predicted outcomes.

Axis Type Detection
Axis types (e.g. Category, Time, Number, Log) are now automatically inferred, based on the data and series type used in the chart.
This feature is enabled by default, however, axis types can also be explicitly configured:
axes: [
  {
    type: 'Category', // or 'number', 'log', 'time'
    position: 'bottom', // or  'top', 'left', 'right'
  },
]
By automatically inferring the axis type, we're simplifying the process for developers, whilst ensuring users benefit from the most suitable chart for their data set.
Large Dataset Interactivity
AG Charts is optimised to handle large datasets with over 1 million points, while maintaining full, smooth interactivity.
Large dataset support is available out of the box, with no additional configuration or modules are required. Learn more about how we achieve the level of performance demonstrated below in our M4 algorithm implementation blog:
By optimising for high performance during interactivity, users can smoothly zoom, pan, and explore charts without lag, even with millions of data points.
Summary
AG Charts 12.2 continues to enhance developer and end-user experience through deeper and broader styling control, and a focus on high performance with large datasets.
As always, we're here to help you upgrade, and we're keen to hear your feedback. Enterprise customers can contact us via Zendesk; Alternatively, please submit a GitHub issue.
Next Steps
New to AG Charts? Get started in minutes, for free:
Considering AG Charts Enterprise? Request a free two-week trial licence to test your application in production and get direct access to our support team.
Happy coding!