

AG Charts 12 is our first major release of 2025. It introduces several new features to our JavaScript Charting Library, focused on introducing new features and improving the developer experience:
- Axis Band Highlight - Shade the entire hovered category or date axis band on hover.
- Axes Label Automatic Wrapping - New collision avoidance strategy of wrapping long axis labels.
- Global Formatter - Easily customise formatting throughout your chart in one place.
- TypeScript Generics - Auto-complete & compile-time validation of chart data & context objects.
- Improved Series Highlight Options - More fine-grained styling control of hovered and unhovered items and series.
- Context Object - New context object for providing additional information to all callbacks within the chart.
Axis Band Highlight
AG Charts 12 provides the ability to highlight the entire band of a category axis on chart hover. Band highlighting can be enabled and customised with the axes[].bandHighlight property.
Highlighting the entire category band on hover improves visual association between data points and their category, enabling end users to easily identify and contextualise grouped data, enhancing data readability and analysis.
Axes Label Automatic Wrapping
AG Charts 12 introduces a new axis label collision avoidance strategy that automatically wraps label text. Label wrapping is enabled by default for category axis labels that contain a space, and can be enabled for all types of labels by setting label.wrapping to 'on-space' or 'always'.
This feature is useful for charts with dense or dynamic data, and ensures that longer labels do not overlap or disappear, preserving clarity and making the chart easier to interpret:
Global Formatter
AG Charts 12 adds a new formatter property which can be used to customise formatting throughout the chart.
This feature helps organise your formatters within your code, keeping them all in one place and removing the need to set these values multiple times in multiple locations:
{
  formatter: {
    // Access the property you want to format
    x: (params) => {
      // Return the formatted value
      const formatter = () => { /* some function */ }
      return formatter.format(params.value);
    },
    // Other formatters...
  }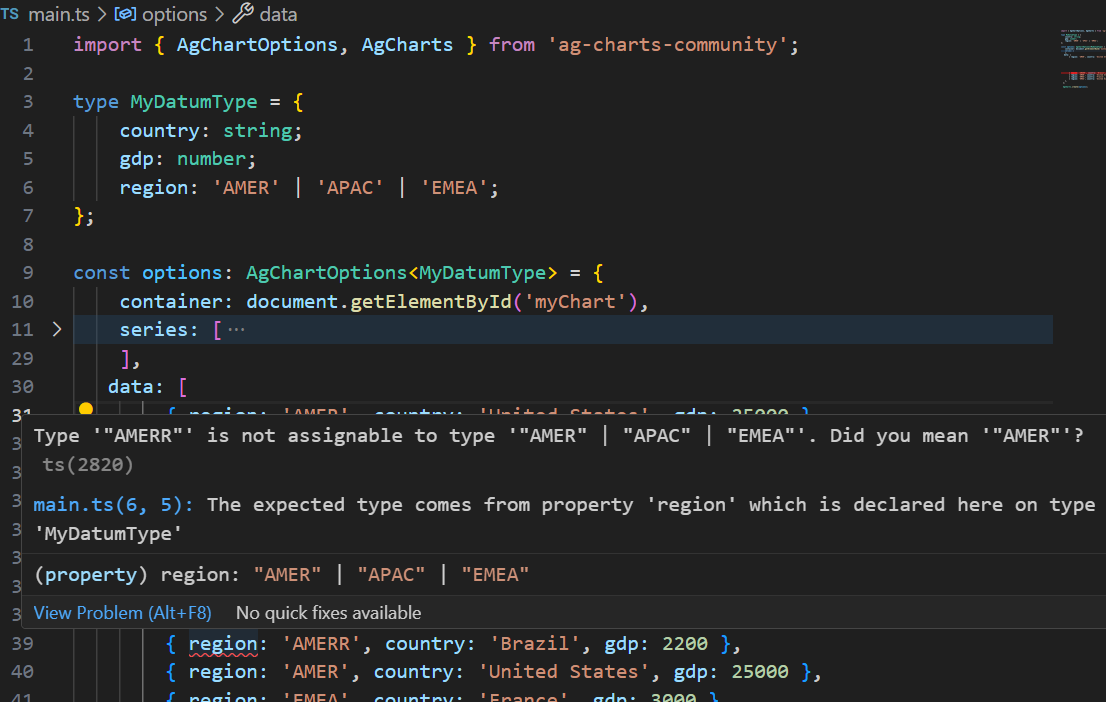
}TypeScript Generics
AG Charts 12 leverages TypeScript Generics for chart data and context objects, significantly enhancing developer experience through improved code completion and compile-time validation of chart options properties:
Improved Highlight Options
AG Charts 12 improves the series highlight options, allowing customisation of the style of highlighted and unhighlighted items within a series, as well as highlighted and unhighlighted series within the chart.
This enables clearer visual distinction and gives developers more control to meet design requirements, making data interpretation faster and more intuitive.
Context Object
AG Charts 12 adds a context object to all callbacks and event handlers. This allows you to attach any additional information to the chart or to individual series and axes, which will be available to all elements.
{
  context: 'my root context',

  listeners: {
    click: ({ context }) => console.log(context), // 'my root context'
  },

  series: [
    {
      type: 'bar',
      context: 'my series context',
      itemStyler: ({ context }) => console.log(context), // 'my series context'
    },
  ],

  axes: [
    {
      type: 'number',
      position: 'left',
      context: 'my axis context',
      label: {
        formatter: ({ context }) => console.log(context), // 'my axis context'
      },
    },
  ],
}
Summary
AG Charts 12 delivers clearer visuals and greater developer control, making charts easier to customize and interpret. Enhanced highlighting, label wrapping, and a global formatter simplify styling, while TypeScript generics and the new context object improve coding efficiency and flexibility.
Next Steps
New to AG Charts? Get started in minutes, for free:
Considering AG Charts Enterprise? Request a free two-week trial licence to test your application in production and get direct access to our support team.
Happy coding!