
AG Grid is a framework-agnostic data grid with over 9 million monthly npm downloads. It offers official support for React, Angular, Vue, & Vanilla JS, and is used by developers across startups and enterprises, including Microsoft, J.P. Morgan, and Amazon.
This page highlights some examples of the features and functionality that you can add to your application with AG Grid, along with live demos and sample code.
Contents
- Use-case Based Examples
- Community Features (Free)
- Enterprise Features (Requires Licence)
- Seed Projects
- Open Source Examples
- 3rd Party Tools & Extensions
Use-case Based Examples
The following examples are designed around specific use cases/verticals, including Performance, Finance, HR, and Inventory Management.
Performance
The performance example is our most comprehensive demo, showcasing advanced features with a 100,000-row data set. The video below demonstrates high-performance rendering and scrolling with no visual lag.
View the full demo to test the grid's performance with more advanced features, such as Integrated Charting, Grouping, Aggregation.
Finance
A popular use case for AG Grid, given our ubiquity in the financial sector, this demo showcases High-Frequency Updates in the form of price changes, which are also visualised with Sparklines. Sparklines are an Integrated Charting feature, which is powered by our JavaScript Charting Library: AG Charts:
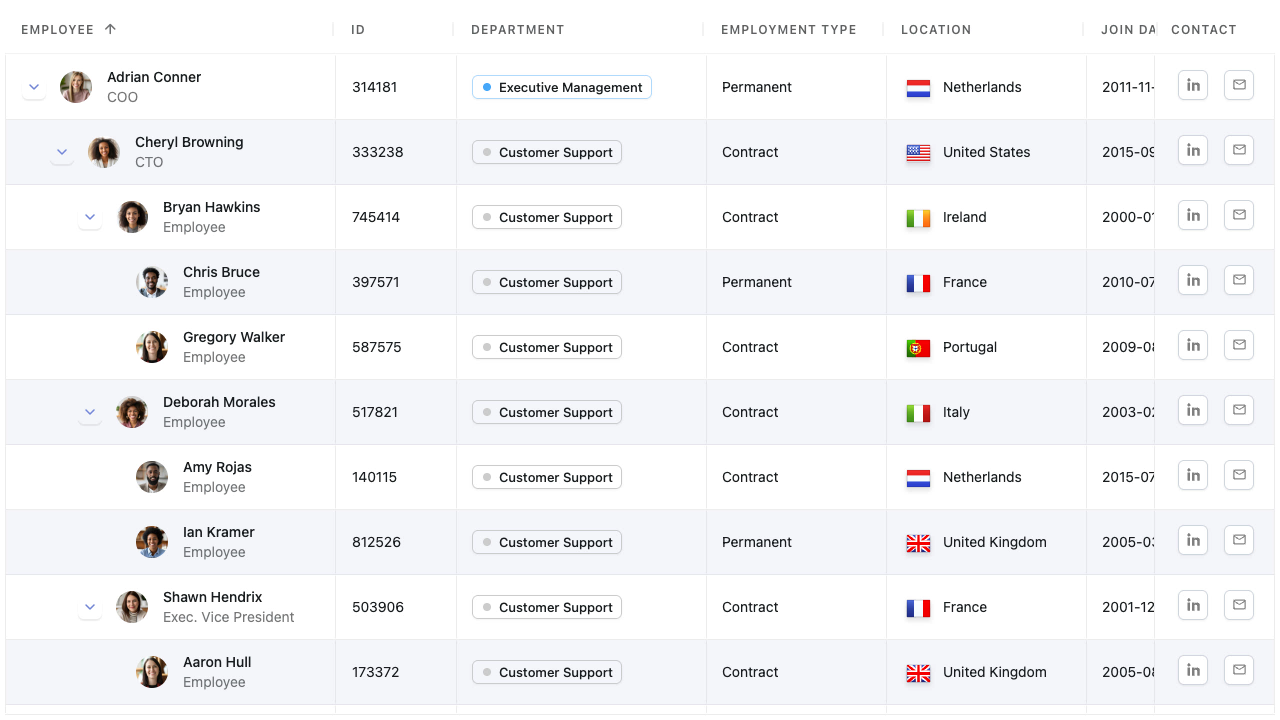
HR
Our HR demo uses Tree Data to display a nested organisation hierarchy and Custom Components to display images and buttons in cells. It also sports a flat, modern design that would fit nicely into a CRM system:
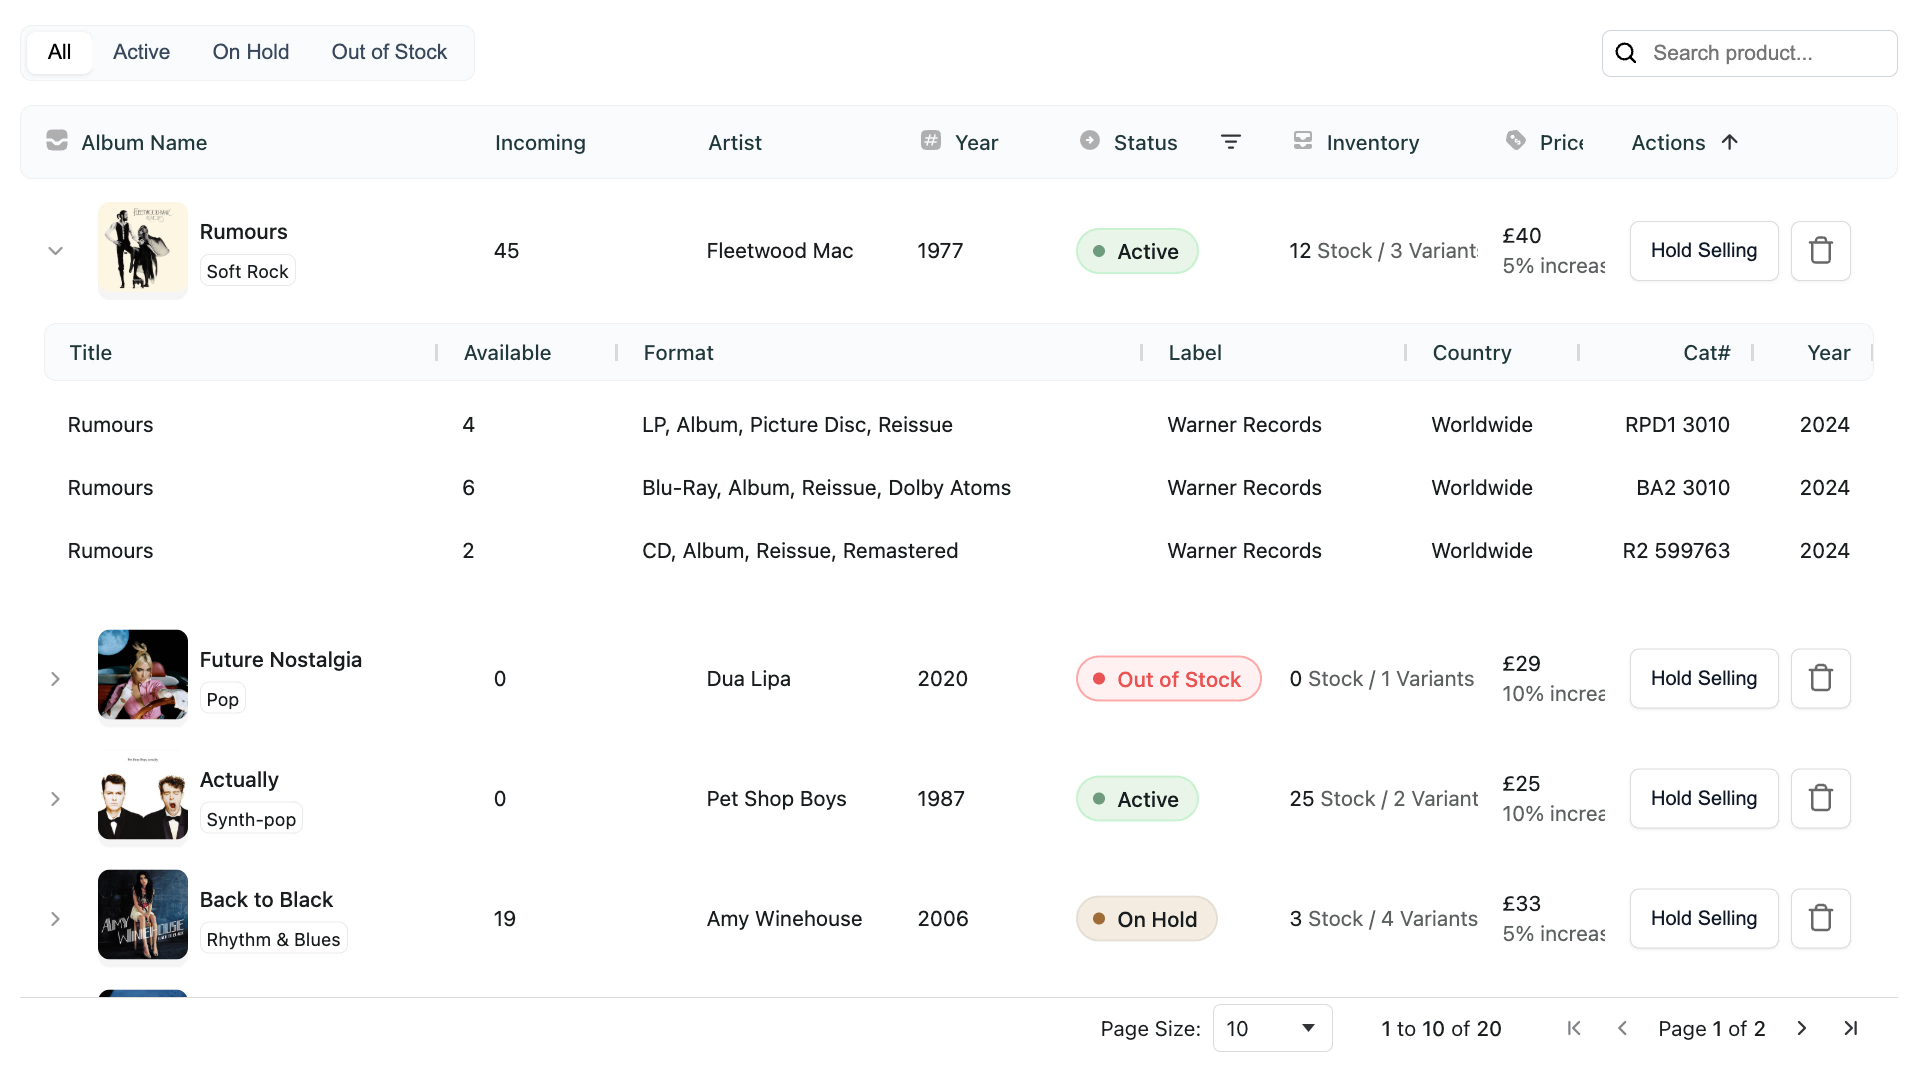
Inventory
Our final example is focused on inventory management, using Master/Detail grids to show stock levels, with External Filter, Search and Custom Components that each trigger real-time updates within the grid:
Community Features Examples
The following examples are all taken directly from our documentation and showcase specific features within the Grid. Every feature listed here is free to use, even commercially. This isn't an exhaustive list, but it does show some of the commonly used features in AG Grid Community.
Showing & Formatting Data
One of the first things you'll want to do when setting up your Data Grid is to display, format and customise the data.
This example demonstrates:
- Using
headerNameto change the text displayed in the header - Using a
valueGetterto format currency values. - Using a
cellRendererto render custom components in cells; in this case, a button. - Using
flexto adjust the size of columns, relative to other columns
Working with Data
After you've displayed some data in your Data Grid and formatted it, you'll likely want to enable features that allow your users to interact with the data.
This example demonstrates:
- Enabling
rowSelectionandpagination. - Enabling
filtersandfloatingFilterson columns. The type of filter (e.g. text, number, etc...) is inferred from the data type. - Enabling
editingon cells, including configuring drop-downs and passing customcellEditorcomponents into the grid.
Theming
Finally, after configuring the required features, you can customise the grid’s appearance using the Theming API and Cell & Row Styles.
Theming APIThe Theming API allows you to control the style of the grid and provides 100+ parameters that can be customised, including icons, borders, fonts, and much more:
Theme BuilderWe also provide the Theme Builder, a drag-and-drop interface for creating custom themes which can then be exported and added directly to your data grid:
Conditional Styling
In addition to the Theming API, you can also use the cellStyle and rowStyle properties to apply styles conditionally based on cell and row values, much like the conditional formatting feature in Excel:
Enterprise Features Examples
The following examples are part of AG Grid Enterprise and demonstrate advanced features.
You can try all of these features for free in a local application by running npm install ag-grid-enterprise - You'll just see a console error and a watermark.
Request a free two-week trial licence to test Enterprise features in production, remove the watermark & console errors, and get access to our dedicated support team to help integrate AG Grid Enterprise into your app.
Integrated Charts
Integrated Charts allows you to create Charts directly from your Data Grid. This feature is unique to AG Grid and not available in any other library.
Users can create and configure Charts dynamically via the UI:
Charts can also be created programmatically via the API - any updates within the grid are automatically (and immediately) reflected in the chart:
Find
Find allows users to search for values within the grid, with all matches highlighted and navigable, similar to how ^Ctrl + F works within the browser:
Advanced Filter
The Advanced Filter allows for complex filter conditions to be entered across columns in a single type-ahead input, or within a hierarchical visual builder:
Grouping
Row Grouping allows rows with equivalent cell values to be grouped under shared parent rows. Users can control which rows are grouped by dragging column headers into the Row Group Panel:
Aggregation
Aggregation automatically calculates group values in the grid. Most common calculations, including sum, min, max, count, average, first and last, are supported out of the box. You can also provide Custom Functions to create your own aggregation logic:
Pivoting
Pivoting breaks down your data in additional dimensions, swapping rows with columns, and vice versa.
Pivoting can be enabled by default on specific columns with the pivot={true} Column Option and we also provide a Pivot Panel so the user can easily configure pivoting via the UI:
Master / Detail
Master Detail refers to a top-level grid, called a Master Grid, with expandable rows. When the row is expanded, another grid, called a Detail Grid, is displayed with more details related to the expanded row.
Tree Data
Tree Data provides a way to display hierarchical structures, such as categories with subcategories or projects with associated tasks.
Excel Export
Excel Export, by default, exports the grid as it is currently rendered, including any sorting, filtering, grouping and other configurations which are currently applied. The export can be triggered by users via the Context Menu, or programmatically via the Grid API:
Seed Projects
The following Seed Projects are templates to help you get started with AG Grid quickly and easily, in your chosen development environment and framework:
| GitHub Repo | Framework | Development Environment |
|---|---|---|
| Angular CLI | Angular | Angular CLI |
| Vite - TypeScript | JavaScript | Vite |
| Webpack 5 - JavaScript | JavaScript | Webpack 5 |
| Webpack 5 - TypeScript | JavaScript | Webpack 5 |
| Create React App | React | Create React App |
| Create Next App | React | Next.js |
| Vite - React | React | Vite |
| Nuxt - Vue3 | Vue | Nuxt |
| Vite - Vue 3 | Vue | Vite |
Open Source Examples
The majority of AG Grid uses are either internal or proprietary, however, there are some open source projects which rely on AG Grid, and we've hand-picked a few here from a range of different use-cases. You can dig into the source code of each of these applications to see exactly how and where they use AG Grid.
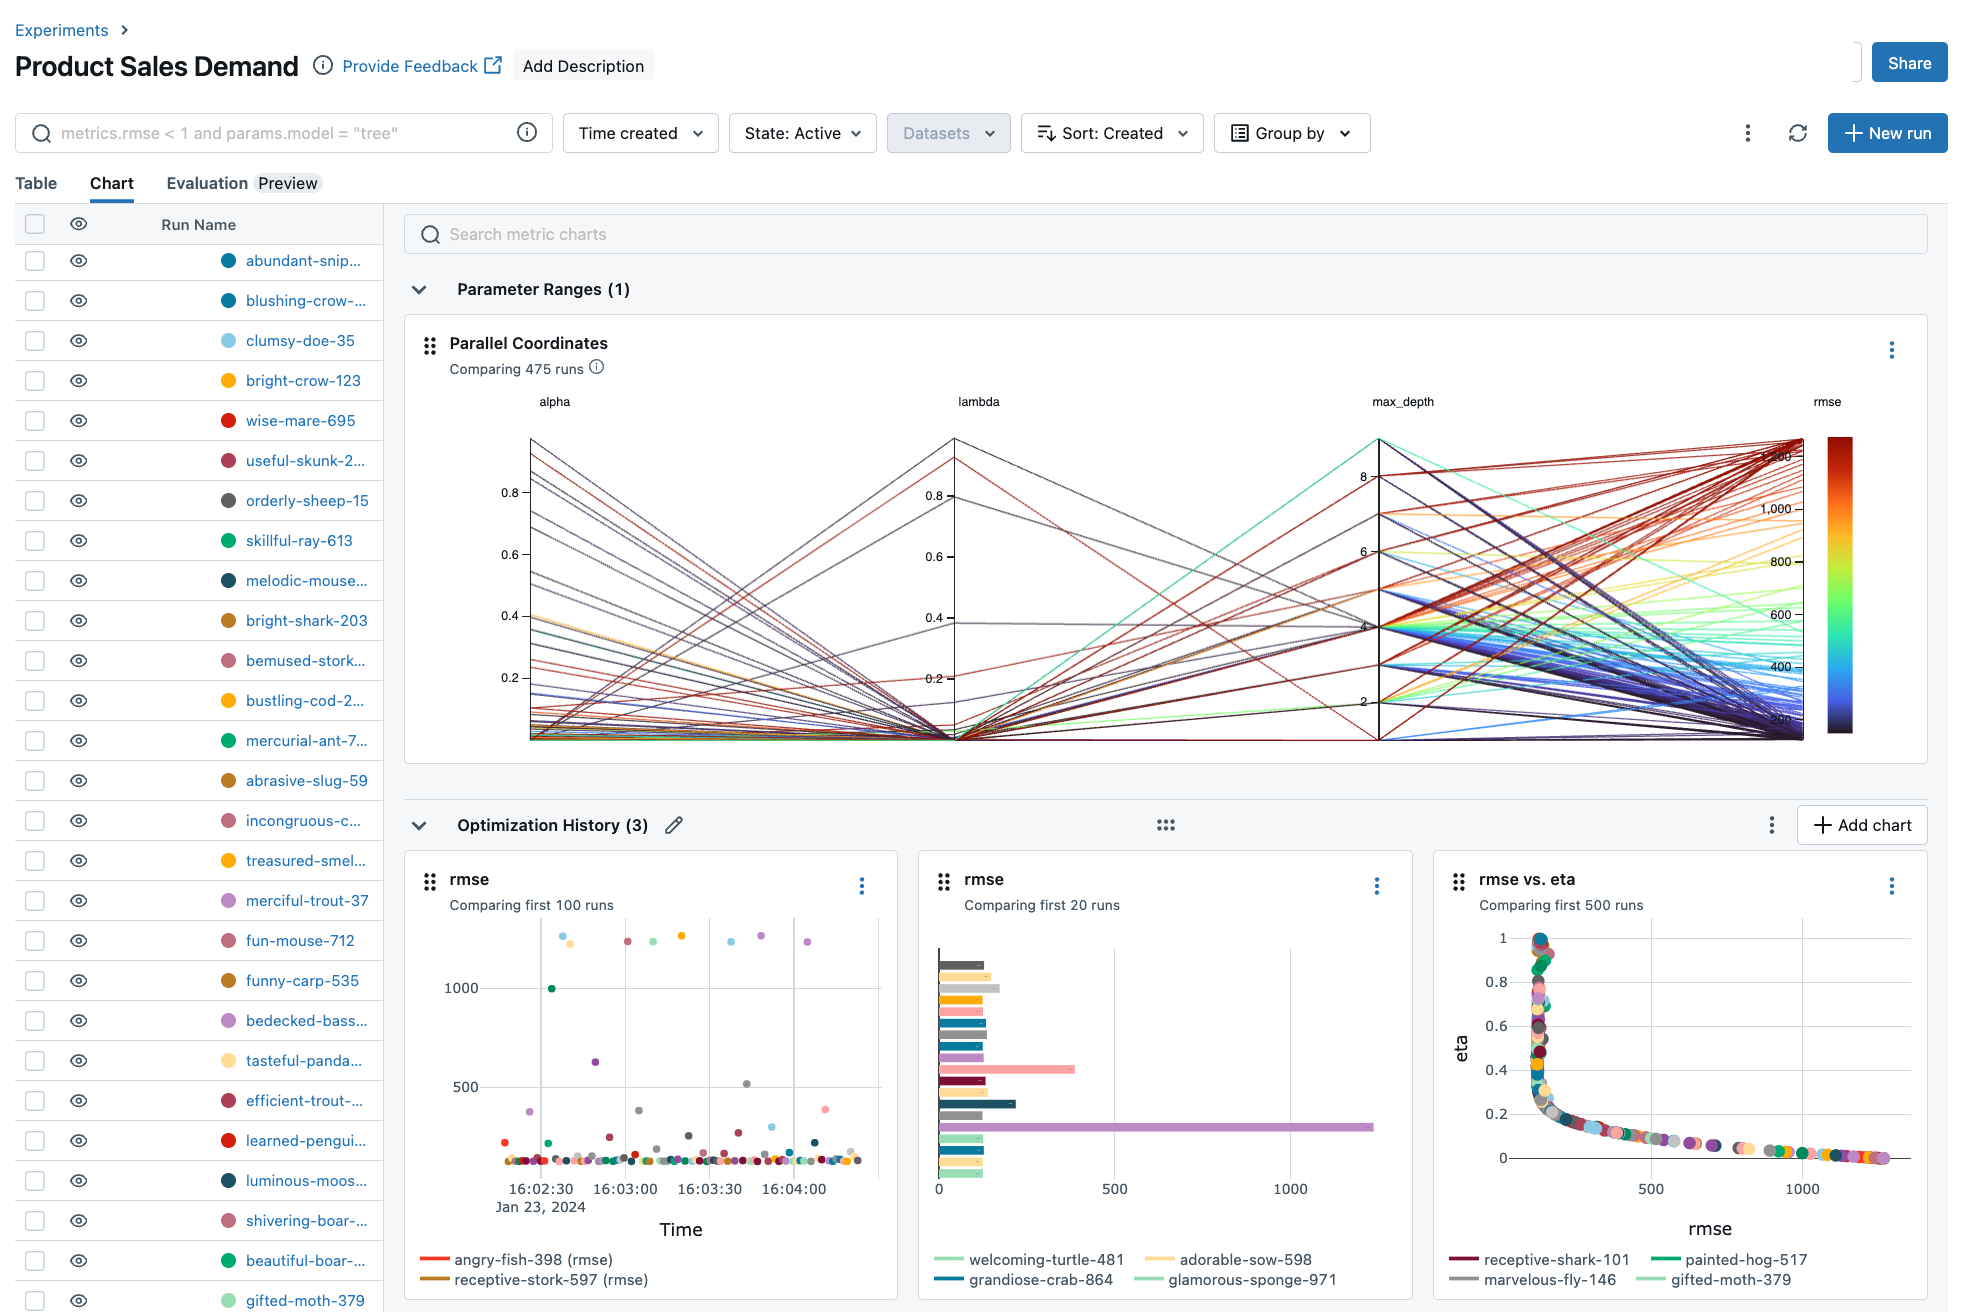
MLFlow
MLflow is a platform to streamline machine learning development, including tracking experiments, packaging code into reproducible runs, and sharing and deploying models. They use AG Grid to display their model data in tabular format:
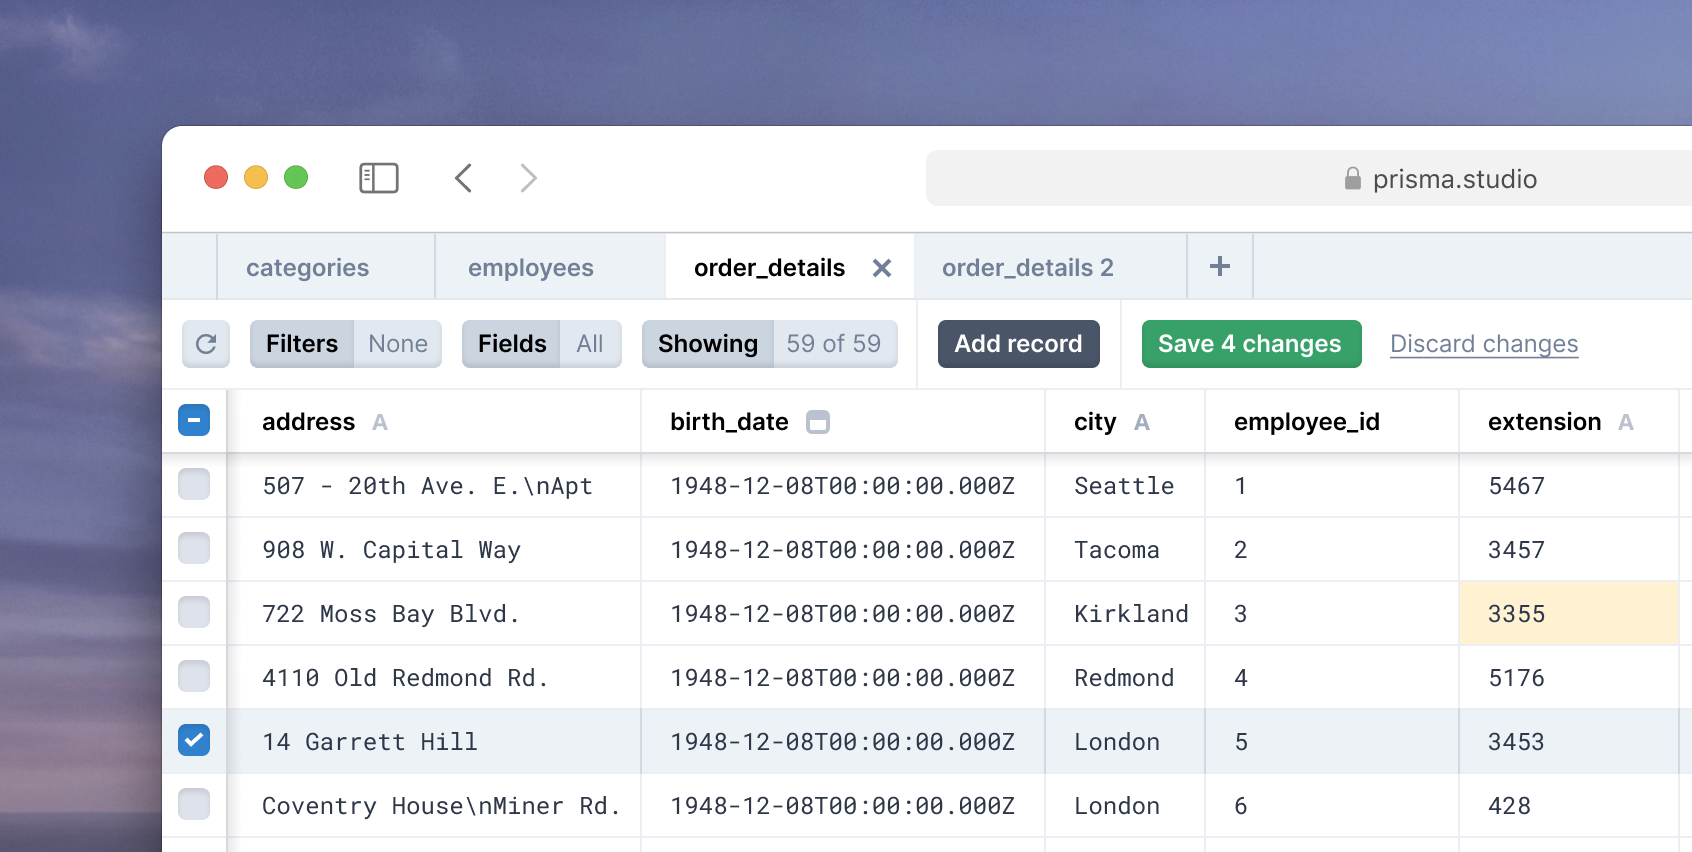
Prisma Studio
Prisma is a popular Database ORM solution, and their Studio application is "the easiest way to explore and manipulate your data in all of your Prisma projects". AG Grid is used as the main way of exploring and manipulating this data inside of Prisma Studio:
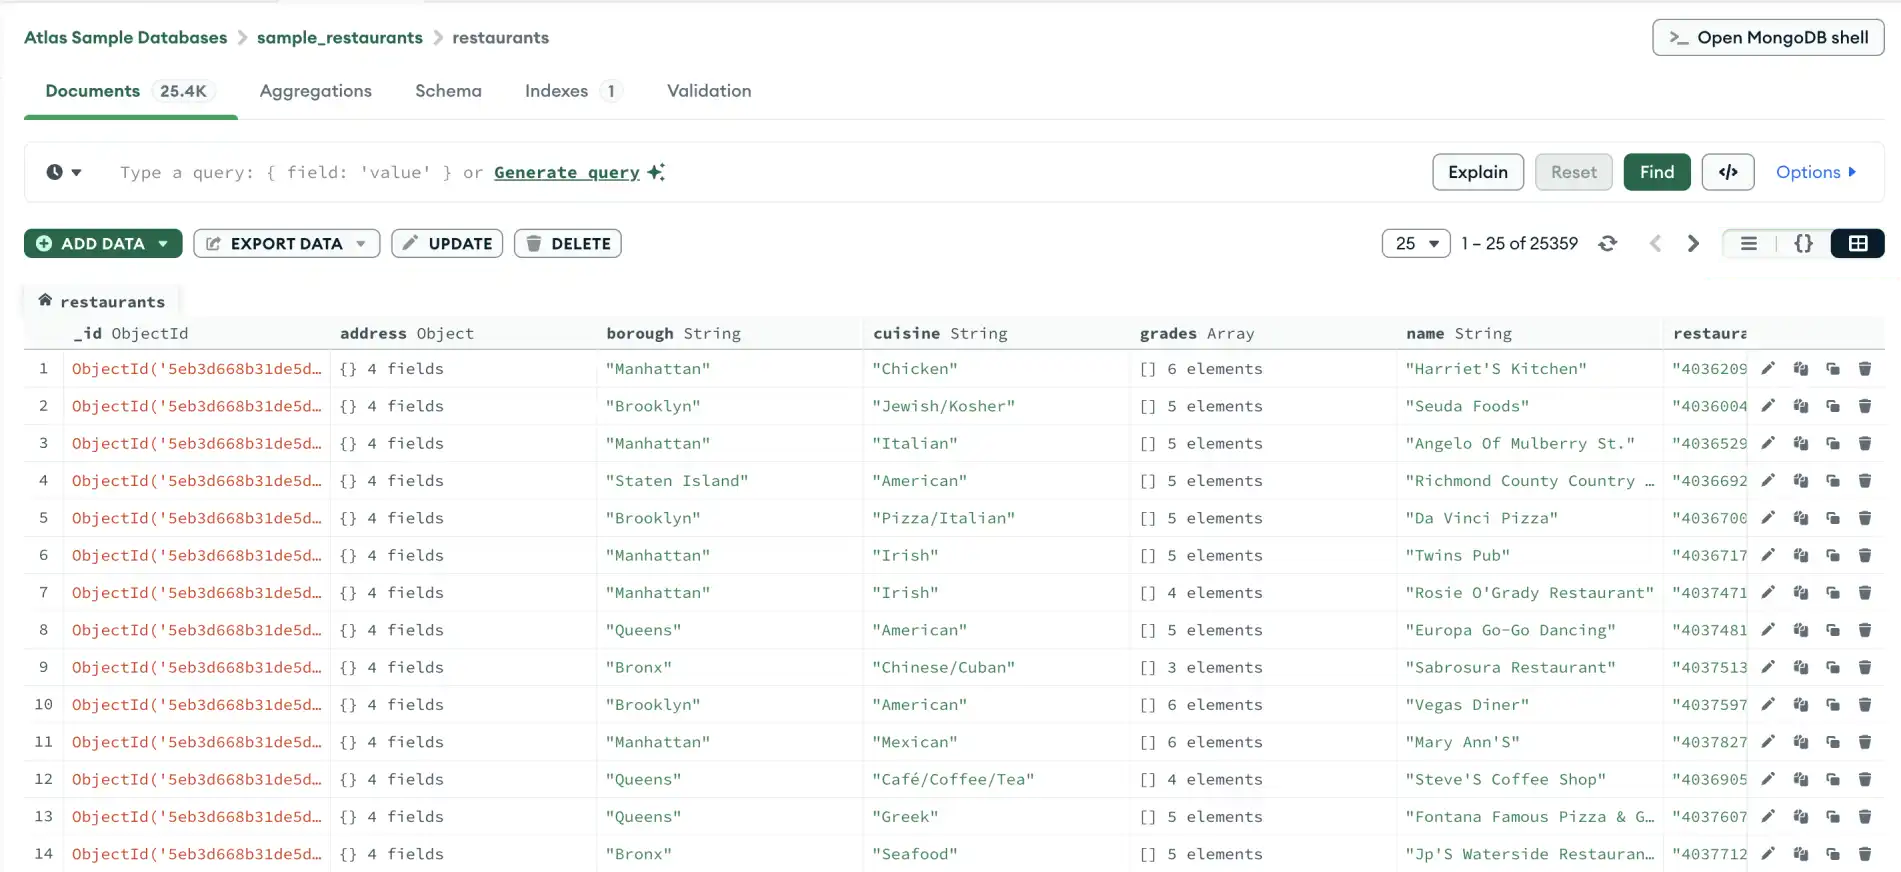
MongoDB Compass
MongoDB Compass is the GUI for MongoDB - a free interactive tool for querying, optimising, and analysing your MongoDB data. AG Grid is used to power the table views within Compass:
J.P.Morgan Salt DS
Salt is J.P. Morgan's open-source design system, providing accessible components and extensive design resources to create exceptional digital experiences across lines of business. AG Grid is used extensively throughout J.P. Morgan, and the Salt DS provides theme packages that apply the Salt theme styles to AG Grid.

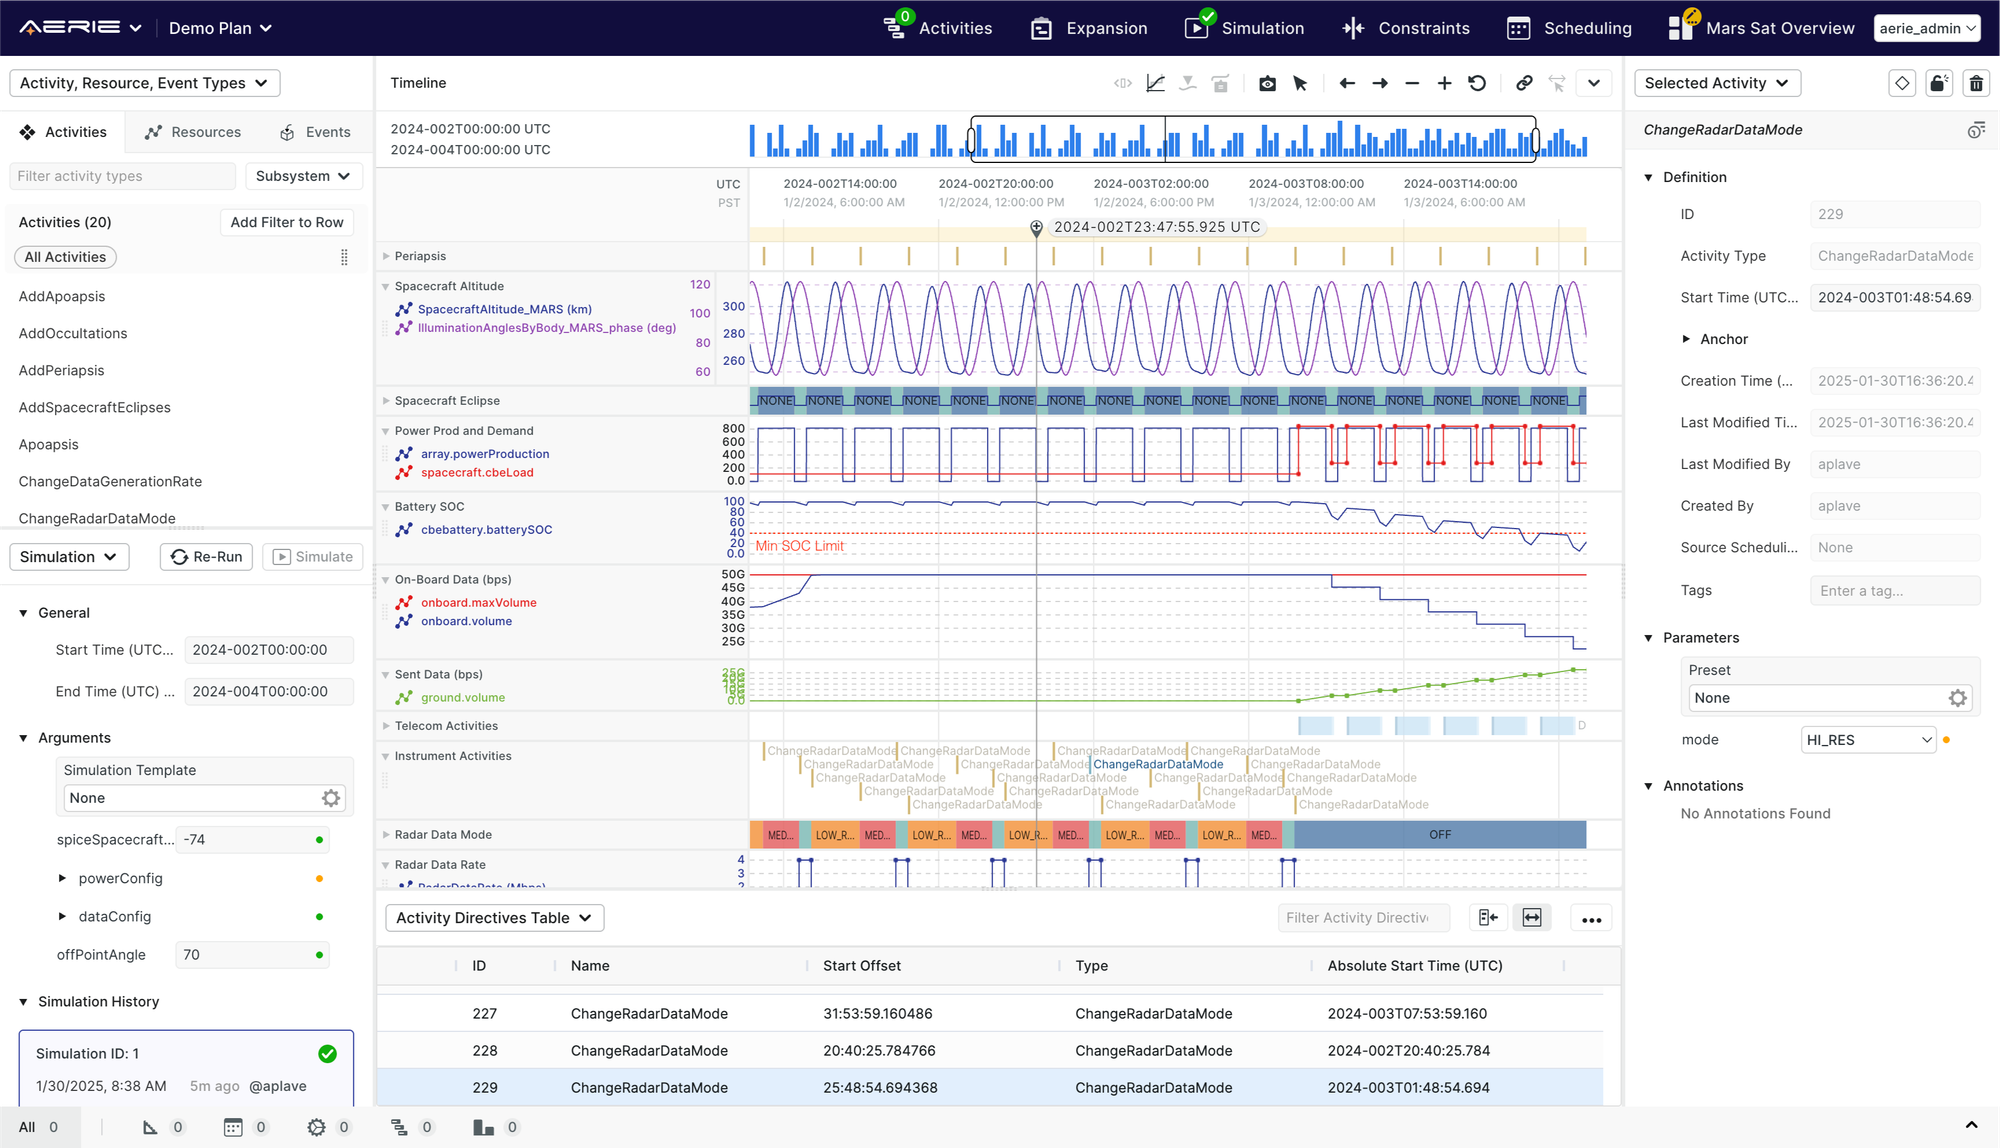
NASA Aerie UI
Aerie is a multi-mission activity planning, resource simulation, and command sequencing software framework currently being developed by the Advanced Multi-Mission Operations System team at the Jet Propulsion Laboratory. AG Grid is used within the broader UI to track activities, resources, and related mission planning data.
If you want to have your app featured in this list, email us at info@ag-grid.com
3rd Party Tools & Extensions
AG Grid has become so popular that a whole ecosystem of tools and extensions has been built by the community, ranging from extensions that enhance the core functionality of AG Grid, to wrappers that enable its usage with frameworks and languages, including Python, Svelte, Solid and even .NET.
Adaptable
AdapTable is a sophisticated low-code extension that complements AG Grid by providing cutting-edge data-related functionality that advanced AG Grid users require and expect.
Plotly Dash AG Grid
Dash is the original low-code framework for rapidly building data apps in Python, which contains a wrapper for AG Grid.

Reflex AG Grid
Reflex is an open-source framework for quickly building beautiful, interactive web applications in pure Python, which also contains a wrapper for AG Grid.
Astro UXDS
Astro UXDS is a collection of guidelines, patterns and components for designing space-based user interface applications that provides a custom Astro theme for AG Grid.

Streamlit AG Grid
Streamlit is an open-source Python framework for machine learning and data science teams. This library, from Pablo Fonseca, implements AG Grid and AG Charts into Streamlit.
Nice GUI
NiceGUI is a Python UI component library which includes a wrapper for AG Grid. NiceGUI is used to write graphical user interfaces which run in the browser, so that developers can focus on writing Python code.
Solid AG Grid
Solid AG Grid is a fully-featured and highly customizable JavaScript data grid. It delivers outstanding performance, has no 3rd party dependencies and integrates smoothly with Solid as a Solid Component.
Svelte AG Grid
AG Grid Svelte is a Svelte wrapper for AG Grid, designed to provide seamless AG Grid integration to any Svelte project. This wrapper exposes all grid options and is fully compatible with AG Grid, up to version 30.
Conclusion
In summary, AG Grid combines industry-leading performance, a comprehensive feature set and an extensible architecture to meet the needs of any data-driven application. Whether you’re building a lightweight CRUD interface with the free Community edition or deploying advanced analytics, charting and pivoting in Enterprise, AG Grid delivers consistency, scalability and full control over both behaviour and appearance.
Ready to try it yourself? Get started in minutes, for free: