What's New in AG Grid 35.2 What's New in AG Charts 13.2 What's New in AG Grid 35.1 What's New in AG Charts 13.1 AI Toolkit: Control AG Grid with natural language commands What's New in AG Charts 13 What's New in AG Grid 35 AG Grid and Bryntum Join Forces to Strengthen Developer Tooling for Modern Web Applications What's New in AG Charts 12.3 What's New in AG Grid 34.3
In Memory of Niall Crosby We are saddened to confirm that our brilliant CEO and founder, Niall Crosby, has tragically passed away in an accident in recent days.
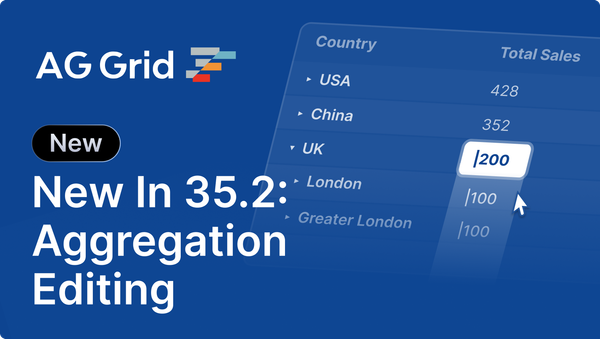
Releases What's New in AG Grid 35.2 AG Grid 35.2 adds aggregation editing, compact row grouping column, deferred updates, rich select cell editor and accessibility improvements
Releases What's New in AG Charts 13.2 AG Charts 13.2 delivers Server-Side Rendering, Range Buttons, Flash on Update and RTL Text and Layout
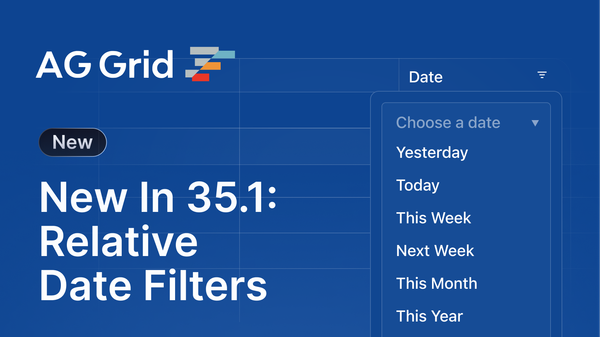
Releases What's New in AG Grid 35.1 AG Grid 35.1 delivers named range date filtering, a powerful formula editor, BigInt support, theme builder import and protecting Excel exports
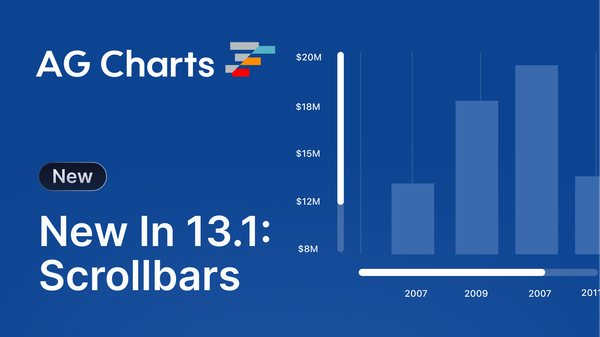
Releases What's New in AG Charts 13.1 AG Charts 13.1 delivers scrollbars, fixed width and width ratio bar sizing, active vs target visualisation and active state API
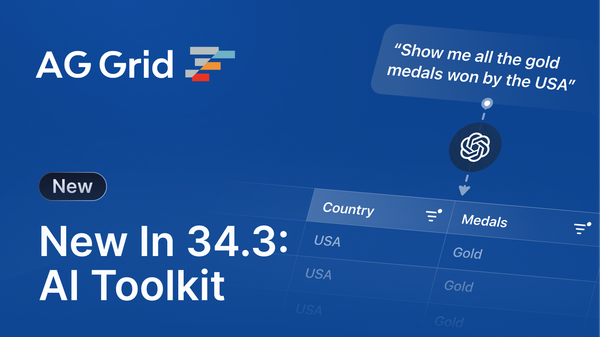
AI Toolkit: Control AG Grid with natural language commands Our new AI Toolkit makes it easy to integrate AI capabilities into AG Grid. It works with any AI provider and gives developers full control over what data is shared and which changes
Releases What's New in AG Charts 13 AG Charts 13 delivers significant performance gains when updating data, up to 45% smaller bundles, smarter defaults, and simpler configurations
Releases What's New in AG Grid 35 AG Grid 35 delivers spreadsheet-style formulas, row group dragging, absolute sorting, column selection, and filtering & export overlays.
Misc AG Grid and Bryntum Join Forces to Strengthen Developer Tooling for Modern Web Applications AG Grid, the leading provider of high-performance data grids and charts for modern web applications, and Bryntum, the leading provider of advanced web components for scheduling and project management, today announced a strategic partnership supported by long-term investment from Adelis Equity.
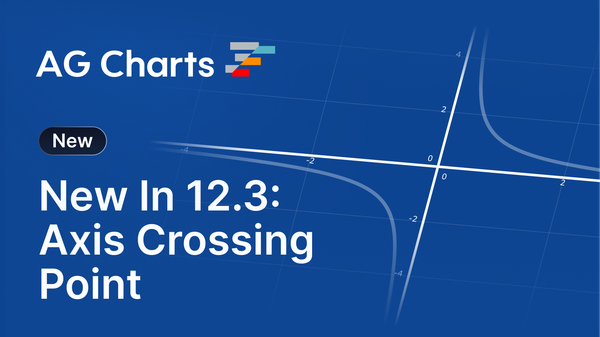
Releases What's New in AG Charts 12.3 AG Charts 12.3 adds axes crossing point, improved Sankey layout and options, difference area chart and range area styling, multi-style labels
Releases What's New in AG Grid 34.3 AG Grid 34.3 introduces a new AI Toolkit and MCP Server, React 19.2 support, and enhancements to column auto-sizing and pivoting.
Releases Introducing the AG Grid Model Context Protocol (MCP) Server Provide MCP-compatible LLMs with access to version and framework-specific documentation, examples, and references in a context-efficient way.
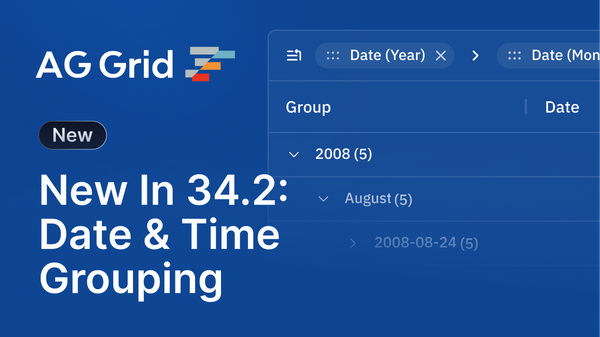
Releases What's New in AG Grid 34.2 AG Grid 34.2 adds date/time grouping, flexible tool panel placement, expand/collapse all groups in SSRM, clipboard and row dragging improvements
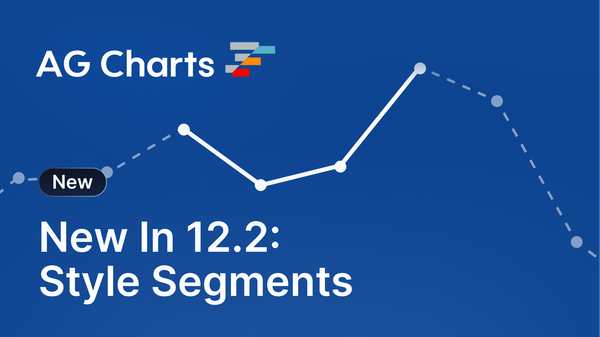
Releases What's New in AG Charts 12.2 AG Charts 12.2 adds label item stylers, series level stylers, style segments, axis type detection and interactivity support for large datasets
Design System What's New in AG Grid's Figma Design System Figma Variables now map 1:1 with Theming API parameters, simplifying designer -> developer hand-off. Learn more about these changes, and how to get started with the Figma Design System.
Releases What's New in AG Charts 12.1 AG Charts 12.1 introduces alternating band shading, extra zoom-axis intercations, axis label truncation, a floating legend, fills and borders for chart elements, and support for multi-style text elements.
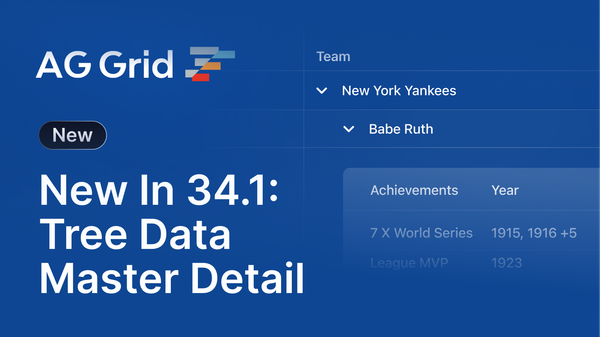
Releases What's New in AG Grid 34.1 AG Grid 34.1 introduces tree data support for master/detail, testing IDs, improved integrated charts formatters, and accessibility improvements.
How To How To Add and Delete Rows in AG Grid from the Context Menu Add Excel-style row operations to AG Grid. Right-click to insert/delete rows based on cell selection. Includes live demo & source code for React, Angular, Vue and JS.
Releases What's New in AG Grid 34 AG Grid Enterprise 34 introduces a new filters tool panel, cell editor validation, bulk & batch cell editing, and support for tree data drag & drop.
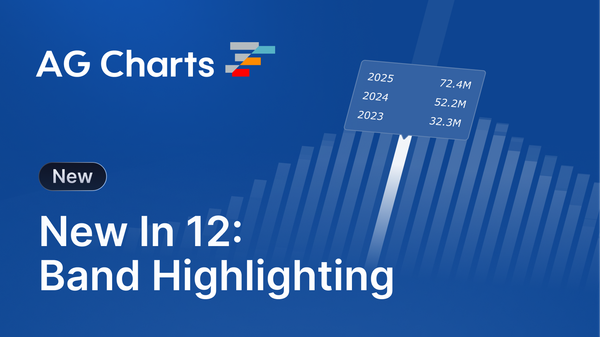
Releases What's New in AG Charts 12 AG Charts 12 adds Axis Band Highlight, Axis Label Automatic Wrapping, Global Formatter, `context` Object, Typescript Generics for Data and Context, Improved Series Highlight Options and more
Misc AG Grid Showcase: Sample Apps, Demos, Examples & Extensions Explore AG Grid’s best features with live demos, use case examples, open source apps, and seed projects for React, Angular, Vue, and JavaScript.
Misc No user left behind: let’s talk accessibility Today is Global Accessibility Awareness Day (GAAD). Learn more about global accessibility standards, why they're important, and how we can help make your apps accessible.